0
$\begingroup$

A 3d Mesh on plot.ly online graph maker (https://plot.ly/create/#/) takes 3 mandatory variables (X, Y, Z) and 3 optional variables (I, J, K). I understand that if I want to draw a cube that I then have to use the IJK-variables, since without them nothing will be drawn.

After some googling I found that with i, j, k you can represent vectors. Though I do not understand how in the following examples they correspond to the XYZ values, so that a cube can be drawn. There are several examples of cubes and cuboids on plot.ly, all of which share the same i, j, k, values. f.e. https://plot.ly/create/?fid=RPlotBot%3A3933#/

https://plot.ly/create/?fid=markope%3A143#/

Taking the first link as an example:

x   y   z       i   j   k
0   0   0       7   3   0
0   1   0       0   4   7
1   1   0       0   1   2
1   0   0       0   2   3
0   0   1       4   5   6
0   1   1       4   6   7
1   1   1       6   5   1
1   0   1       6   2   1
                4   0   5
                0   1   5
                3   6   7
                2   3   6

This will draw a normal cube. When I try my XYZ-coordinates, however, it will draw following: enter image description here
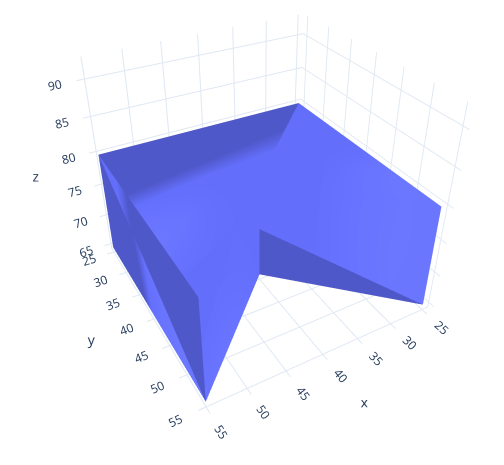
My xyz-coordinates are:

x   y   z
25  25  65
25  55  65
55  25  65
55  55  65
25  25  80
25  55  80
55  25  80
55  55  80

How can I calculate the according ijk-values so that I get a cuboid? Any tips or links to resources?

The official tutorial for a 3d mesh on plot.ly online graph maker only mentions the ijk-values, doesn't explain them though.

$\endgroup$

2 Answers 2

5
$\begingroup$

Most mesh drawing tools use triangles to draw meshes, for technical reasons.

You could simply specify the coordinates of the three vertices of each triangle, but that is a bit wasteful in terms of memory.

What is done in many places is to specify a list of points in space, with their coordinates, and then specify a list of triangles, using indices of the points in the first list.

The exact same thing happens here. The x,y,z parameters form a list of points. The I,j,k parameters indicate triangles, using IDs in the list of points.

Have a look at the function documentation for more details: https://plot.ly/python/reference/#mesh3d

$\endgroup$
1
  • 1
    $\begingroup$ It took me a good 2 hours to understand this simple idea. Reading back and forth from your answer to your referenced documentation I finally understood what you meant by "..indices of the points in the first list". I was thinking in the context of math here, and what indices could possibly mean in that context. But it's actually just indices in the programming context, i.e. indices of an array f.e. In my case that means f.e. that the first i-value (7) just means "this vertex points to the x-y-z-point with index 7 (which is the last one since I only have 8 points) in the x-y-z-list". $\endgroup$
    – thz
    Commented Jul 1, 2019 at 9:49
0
$\begingroup$

You might find the answer at https://stackoverflow.com/questions/77265426/python-plotly-planes-perpendicular-to-axes-in-3d-plot very helpful. Essentially your x,y, and z lists form a number of vectors (so the total number of vectors is size(x)=size(y)=size(z)=(8 in your example), and the i,j,k each specify a particular vector. So each triangle is formed from 3 vectors. The total number of triangles is size(I)=size(j)=size(k)= (12 in your example). The lth triangle is formed from combining the i[l] vector, the j[l] vector, and the k[l] vector. In the example you provided, the first triangle would be formed from vectors [1,0,1],[1,0,0],[0,0,0], since these are the 7th,3rd, and 0th vectors respectively.

$\endgroup$

Your Answer

By clicking “Post Your Answer”, you agree to our terms of service and acknowledge you have read our privacy policy.

Not the answer you're looking for? Browse other questions tagged or ask your own question.