3
$\begingroup$

Here's a constructor to construct a axis-aligned bounding box given two opposite vertices on the bounding box, from Pharr's Physically Based Rendering, Third Edition.

BBox(const Point &p1, const Point &p2) {
    pMin = Point(min(p1.x, p2.x), min(p1.y, p2.y), min(p1.z, p2.z));
    pMax = Point(max(p1.x, p2.x), max(p1.y, p2.y), max(p1.z, p2.z));
}

I don't understand why this works; for example if I take $P_1 = (1,2,3)$ and $P_2 = (2,1,4)$, I'll get $\text{pMin} = (1,1,3)$ and $\text{pMax} = (2,2,4)$. The bounding box between $P_1$ and $P_2$ is doesn't look same as bounding box between pMin and pMax.

The explanation for this constructor given in the book :

If the caller passes two corner points (p1 and p2) to define the box, since p1 and p2 are not necessarily chosen so that p1.x <= p2.x, and so on, the constructor needs to find their component-wise minimum and maximum values.

As far as I understand, if p1.x is less than p2.x then pMin = p1. So we should only be checking against p1.x and p2.x.

Am I missing something ? The above constructor doesn't feel correct for axis-aligned bounding boxes.
$\endgroup$

2 Answers 2

7
$\begingroup$

In short; The constructor is correct.

As far as I understand, if p1.x is less than p2.x then pMin = p1. So we should only be checking against p1.x and p2.x.

I get where the confusion comes from, but the explanation meant something else. It meant that when $p1$ and $p2$ are given, they are not always ordered so that $p1$ is always $pMin$ and $p2$ is always $pMax$. So we need to find out. However, it could be that when solely looking at the x-axis, $p1$ is $pMin$, but when looking at the y-axis, $p2$ is $pMin$. So, we need to find $pMin$ and $pMax$ for each of their components, seperately.

If we look at a two dimensional example, we can see more easily how it works.

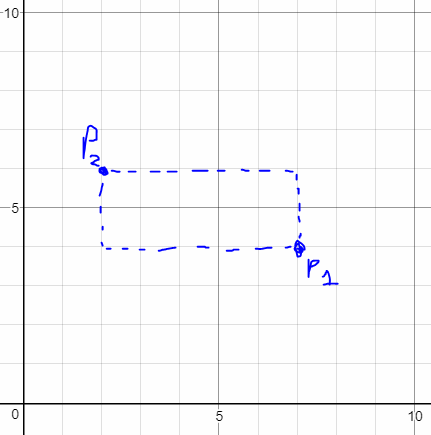
We have $p1=(7, 4)$ and $p2=(2, 6)$.

Graph of p1 and p2

We want to get $pMin$ and $pMax$. $pMin$ should be the lowest value for all the components. $pMax$ should be the highest value for all the components. That would make calculations a lot easier of course.

When looking at the graph we can easily find $pMin$ and $pMax$.

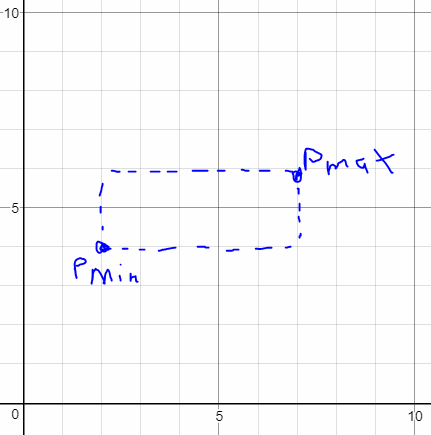
pMin and pMax plotted on a graph

$pMin=(2, 4)$ and $pMax=(7, 6)$

We can see that for $pMin$, we took the lowest value from $p2$ for the x component and the lowest value from $p1$ for the y component. For $pMax$, we took the highest value from $p1$ for the x component and the highest value from $p2$ for the y component.

If we would only look at the x component and determined $pMin$ and $pMax$ from that, we would get $pMin=(2, 6)$ and $pMax=(7, 4)$. This works for the x component, but it makes no sense on the y component, as $pMin$ has the highest y value.

The bounding boxes are still the same. We still store the same rectangle, we just used different points to store it.

When going to the third dimension, it is still exactly the same. You just do the same for the z component as you would do for the x and y components.

$\endgroup$
3
$\begingroup$

As far as I understand, if p1.x is less than p2.x then pMin = p1.

Nope. That would be true if you wanted the caller to only pass the lower-left and upper-right points, but they can be any pair of opposite points. Let's truncate to two dimensions to make it simpler. If $p_1 = (1,2)$ and $p_2 = (2,1)$, they're not the bottom-left and top-right of a rectangle, they're the other two corners. The bottom-left corner is $(1,1)$ and the top-right corner is $(2,2)$. It's no different in three dimensions.

To put it another way, an axis-aligned bounding box is the Cartesian product of three intervals or ranges, one along each axis. It's the set of all points $(x,y,z)$ where $x_{min} < x < x_{max}\ \wedge y_{min} < y < y_{max}\ \wedge z_{min} < z < z_{max}$. You're trying to find the smallest box that contains all of the points you're passed. (In fact, you're only passed two, but it would be the same if you had a whole set of points.) To do that, you find the interval on each axis separately. Just because one of the points you're passed in has the smallest $x$ co-ordinate, that doesn't mean it'll have the smallest $y$ or $z$ co-ordinate, so you take the min and max separately for each axis.

$\endgroup$

Your Answer

By clicking “Post Your Answer”, you agree to our terms of service and acknowledge you have read our privacy policy.

Not the answer you're looking for? Browse other questions tagged or ask your own question.