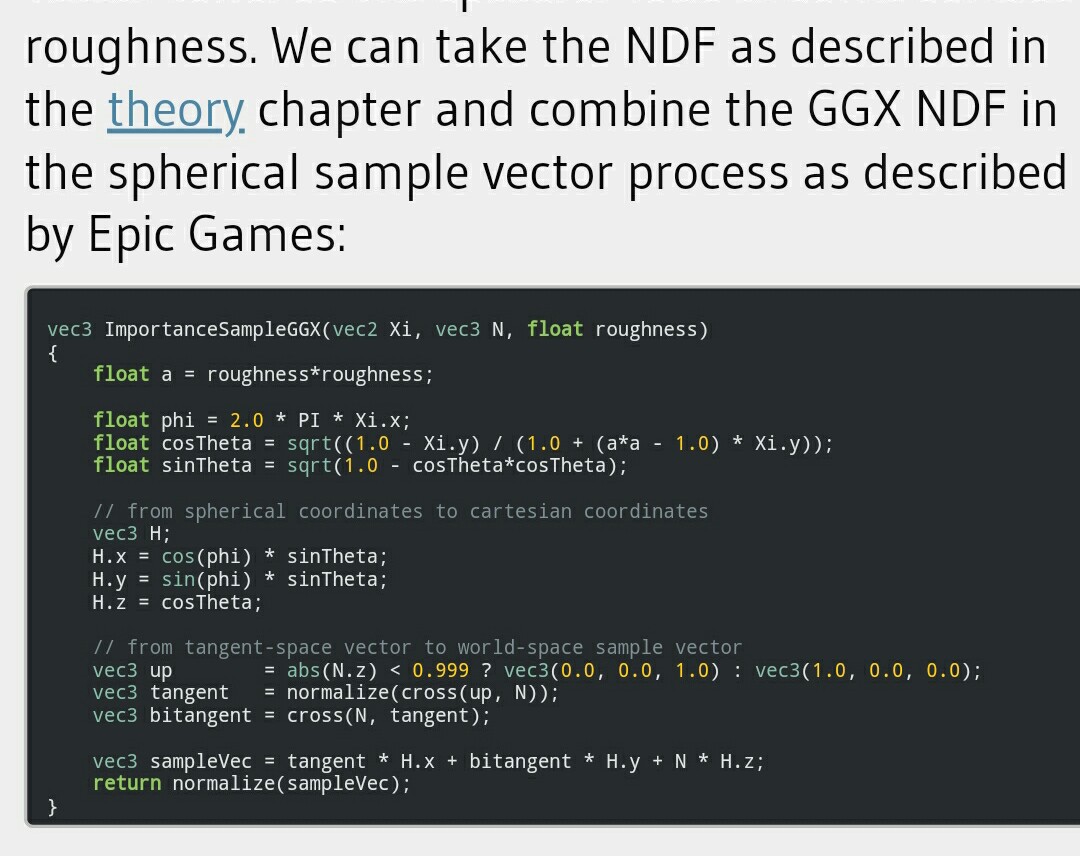
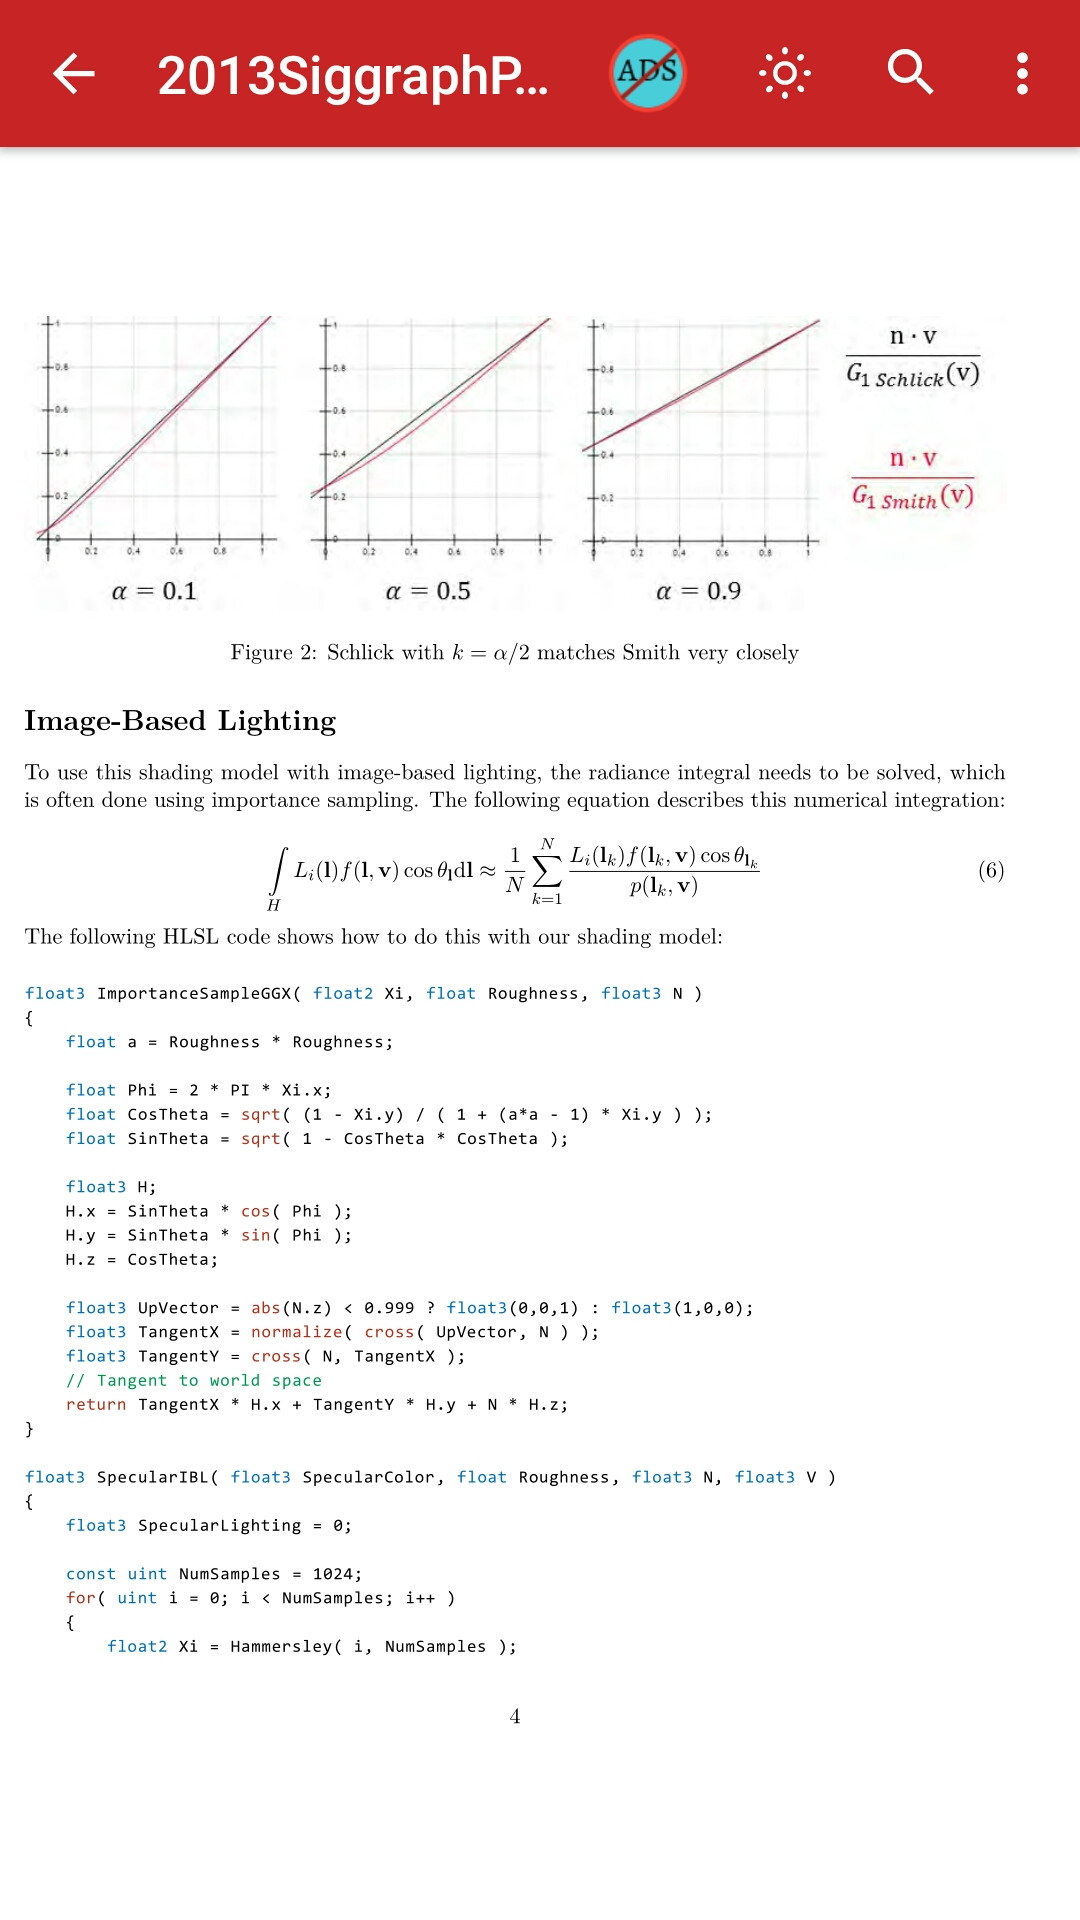
Leaving the actual derivation of mathematics aside, I'll try to give a general description of how can we combine the NDF with importance sampling in spherical coordinates.
What is NDF ?
The problem is the following. Intiutively, we need the NDF for "zooming in" from the realm of macrosurfaces to that of microfacets.
Mathematically it is needed for the following equivalence:
$$dA_h = NDF(h) dw_{h} A$$.
$A$: flat macrosurface patch
$dw_{h}$: is the area of a portion of a unit spherical cap defined by the orientation $h$
$dA_{h}$: is the total area that is being approximated by the orientation $h$
see here for more.
These terms are understood better when we considere the following equivalence:
$$d\Omega = 4\pi (\frac{dS}{A})(\hat{r} \cdot \hat{n})$$
You can read this equivalence as the following:
One can approximate a solid angle subtended by a flat surface whose area equals $dS$, orientation $\hat{n}$, and distance from the viewer $r$ where $\hat{r} = \frac{\vec{r}}{r}$ and $A = 4\pi r^2$. The $\vec{r}$ is a position vector of the surface area $dS$ with respect to the center of the sphere. You can read more about it in wikipedia
The point here is that whenever we consider approximating solid angles with projected surfaces, we need that direction and distance term.
Whether we consider solid angles over microfacets or macrosurfaces don't make a difference. From this perspective, you can think of $NDF$ as "regulation" term for two different granularities involved in approximating the same structure.
Since we are modeling the same structure from two different granularities, we can't "touch" properties that coincides with physical/geometric properties of the structure, but we can "touch" the regulation term, hence different ways of computing ndf are provided by different researchers.
Whatever it maybe though, it has to satisfy the following equivalence for unit sphere:
$$1=\frac{1}{A}\int_{S} (n \cdot h) dA_{h} = \int_{\Omega} NDF(h) (n \cdot h) dw_{h}$$
Where S is the domain of the area of the macrosurface patch. This reads simply as the following: The area we are calculating as a spherical cap using solid angle bits, and the area we are calculating as a macrosurface patch using macro surface patch bits has to be the same.
What is Importance Sampling ?
Here is the second bit of information necessary to understand the procedure.
Let X be a random variable, ie a function whose signature is $X: M \to R $, where $M$ is the sample space and $R$ is the set of real numbers. Expected value $E[X]$ is given under the probability distribution $P$ as the following $E[X;P] = \frac{1}{n} \sum_{i=1}^n x_i$ where n is the total number of samples drawn from the distribution and $x_i$ is sample generated from $X$ using the distribution P.
The precision of the estimate calculated this way depends on the variance of the random variable $X$ under the probability distribution $P$. If we have infinite number of samples, then its okay to use low precision estimates, but we never do. In fact, it would be great if we have a small number of samples, with a more precise way of computing the estimate.
Now think of the following, we have some random variable X, that outputs values according to some distribution, and we want to understand how X works under that distribution. Wouldn't it be better to select the input values for X so that the graph made by the output values look more like the actual graph of the X under distribution P. This is what we are trying to do with importance sampling. The key here is to understand that though we may not know how X maps values in its domain to its codomain, we may know how the probability distribution for choosing samples works. Hence if we choose a function that is similar to random variable's actual probability distribution, we can significantly reduce variance.
How they interact ?
Now coming to your question. We have seen that in order to use importance sampling we need to use function that resembles to the actual probability distribution used for sampling the spherical cap area. So if our function is $f=NDF(h) (n \cdot h)$, we need use a function that is similar to the actual probability distribution of this function to sample values from it in order to get an estimate with higher precision.
Since we are dealing with points on unit sphere, we are dealing with spherical coordinates. The vectors associated with these points are also in spherical coordinates. Now spherical coordinates are defined using two angles and a distance to the center of the sphere. In unit sphere the distance is 1. This leaves us with
the two angles when considering vectors.
The probability distribution associated with $f$ then has two parameters, $\theta$ and $\phi$ due to using spherical coordinates.
Now the probability density function (pdf) of $f$ is given in here. From that we calculate its cumulative distribution function (cdf) which is also given in here.
We need the cdf because of the following property: If $T$ is a continuous random variable with cumulative distribution function $cdf(T)$, then the random variable $Y = cdf(T)$ has a uniform distribution on [0, 1]. Meaning that the inverse of $cdf(T)$ whose input would come from a uniform distribution on [0, 1] would output a value according to the probability distribution of $T$. More on that on wikipedia as suggested by peter.
Coming back to our point. We are looking for function closer to the actual probability distribution of $f$. Why ? Because it is the actual probability distribution that "causes" $f$ to output $x_i$ (sample generated in accordance with the probability distribution of random variable as stated in importance sampling section), since the probability distribution of $f$ takes two parameters, the angles of spherical coordinate, we need to adapt pdf and cdf to deal with two parameters.
It turns out, we can sample one of the angles uniformly, hence
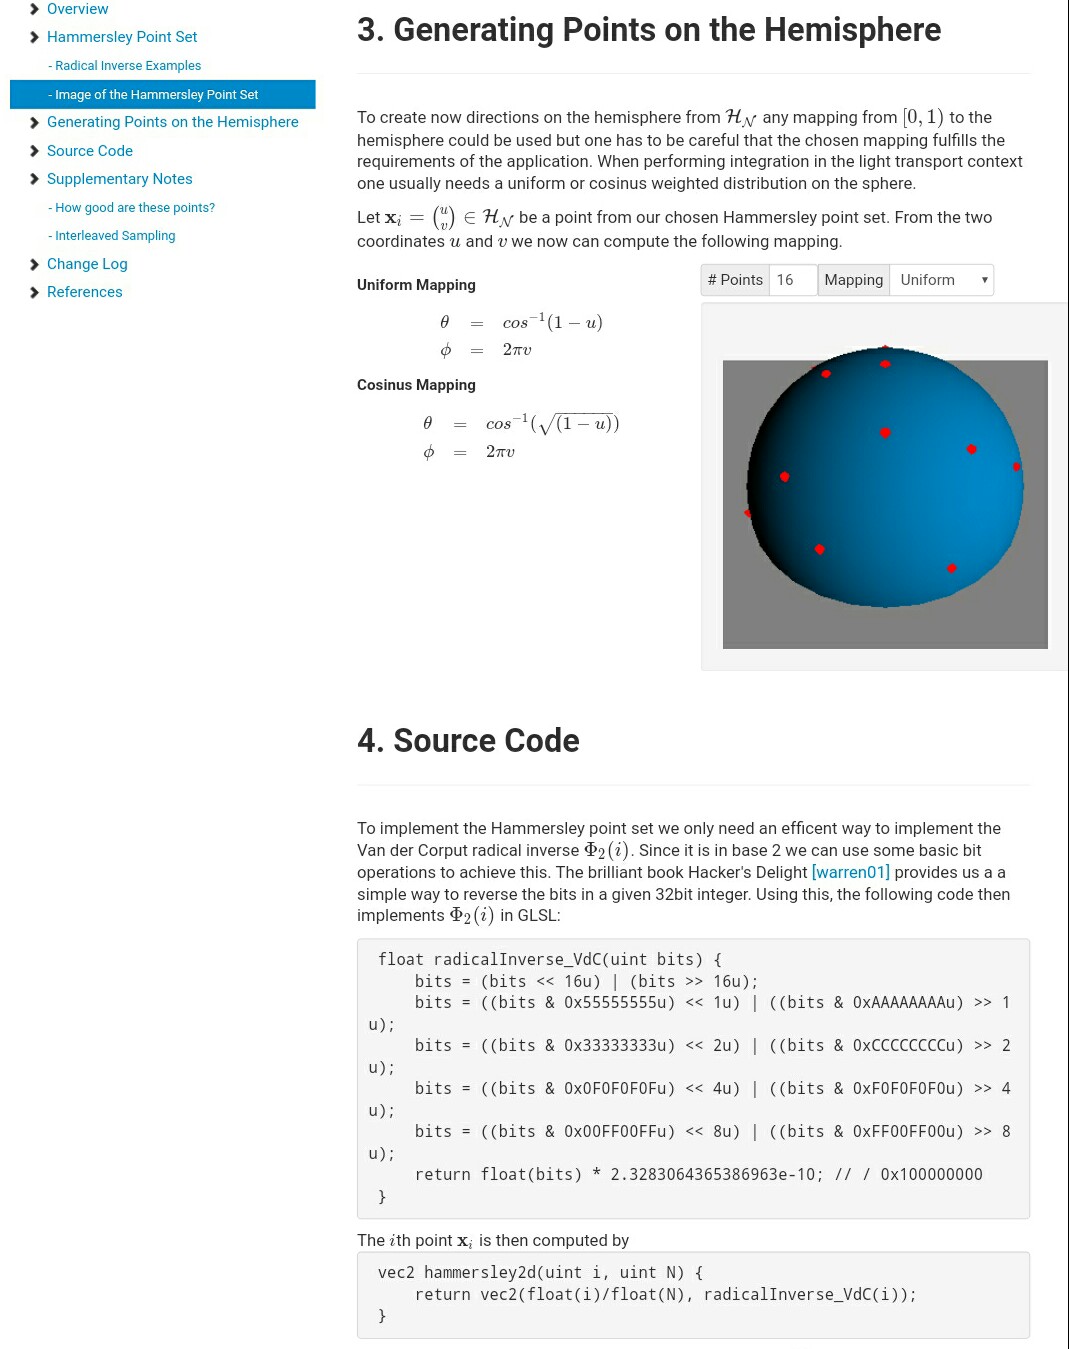
phi = X_i.x * 2 * PI given that X_i.x is a random number between [0,1].
Then we only need to deal with pdf and cdf of a single parameter.
If we can find out manually the inverse of cdf of that parameter, we can map a random value between [0, 1] to a value according to correct distribution of that parameter. The piece of code that deal with X_i.y represents that manually found inverse of cdf.
You can read about the involved mathematics from:


