I have written a very minimal plotting code which take a function $f$ and a domain $[a,b]$ and plots its graph. (It's here, if relevant.)
Now, I query $f$ at the sides of each pixel, and then every vertical pixel in the line gets marked. But this makes an incredibly thin graph unless the pixel density is low. So I want to support variable line thickness.
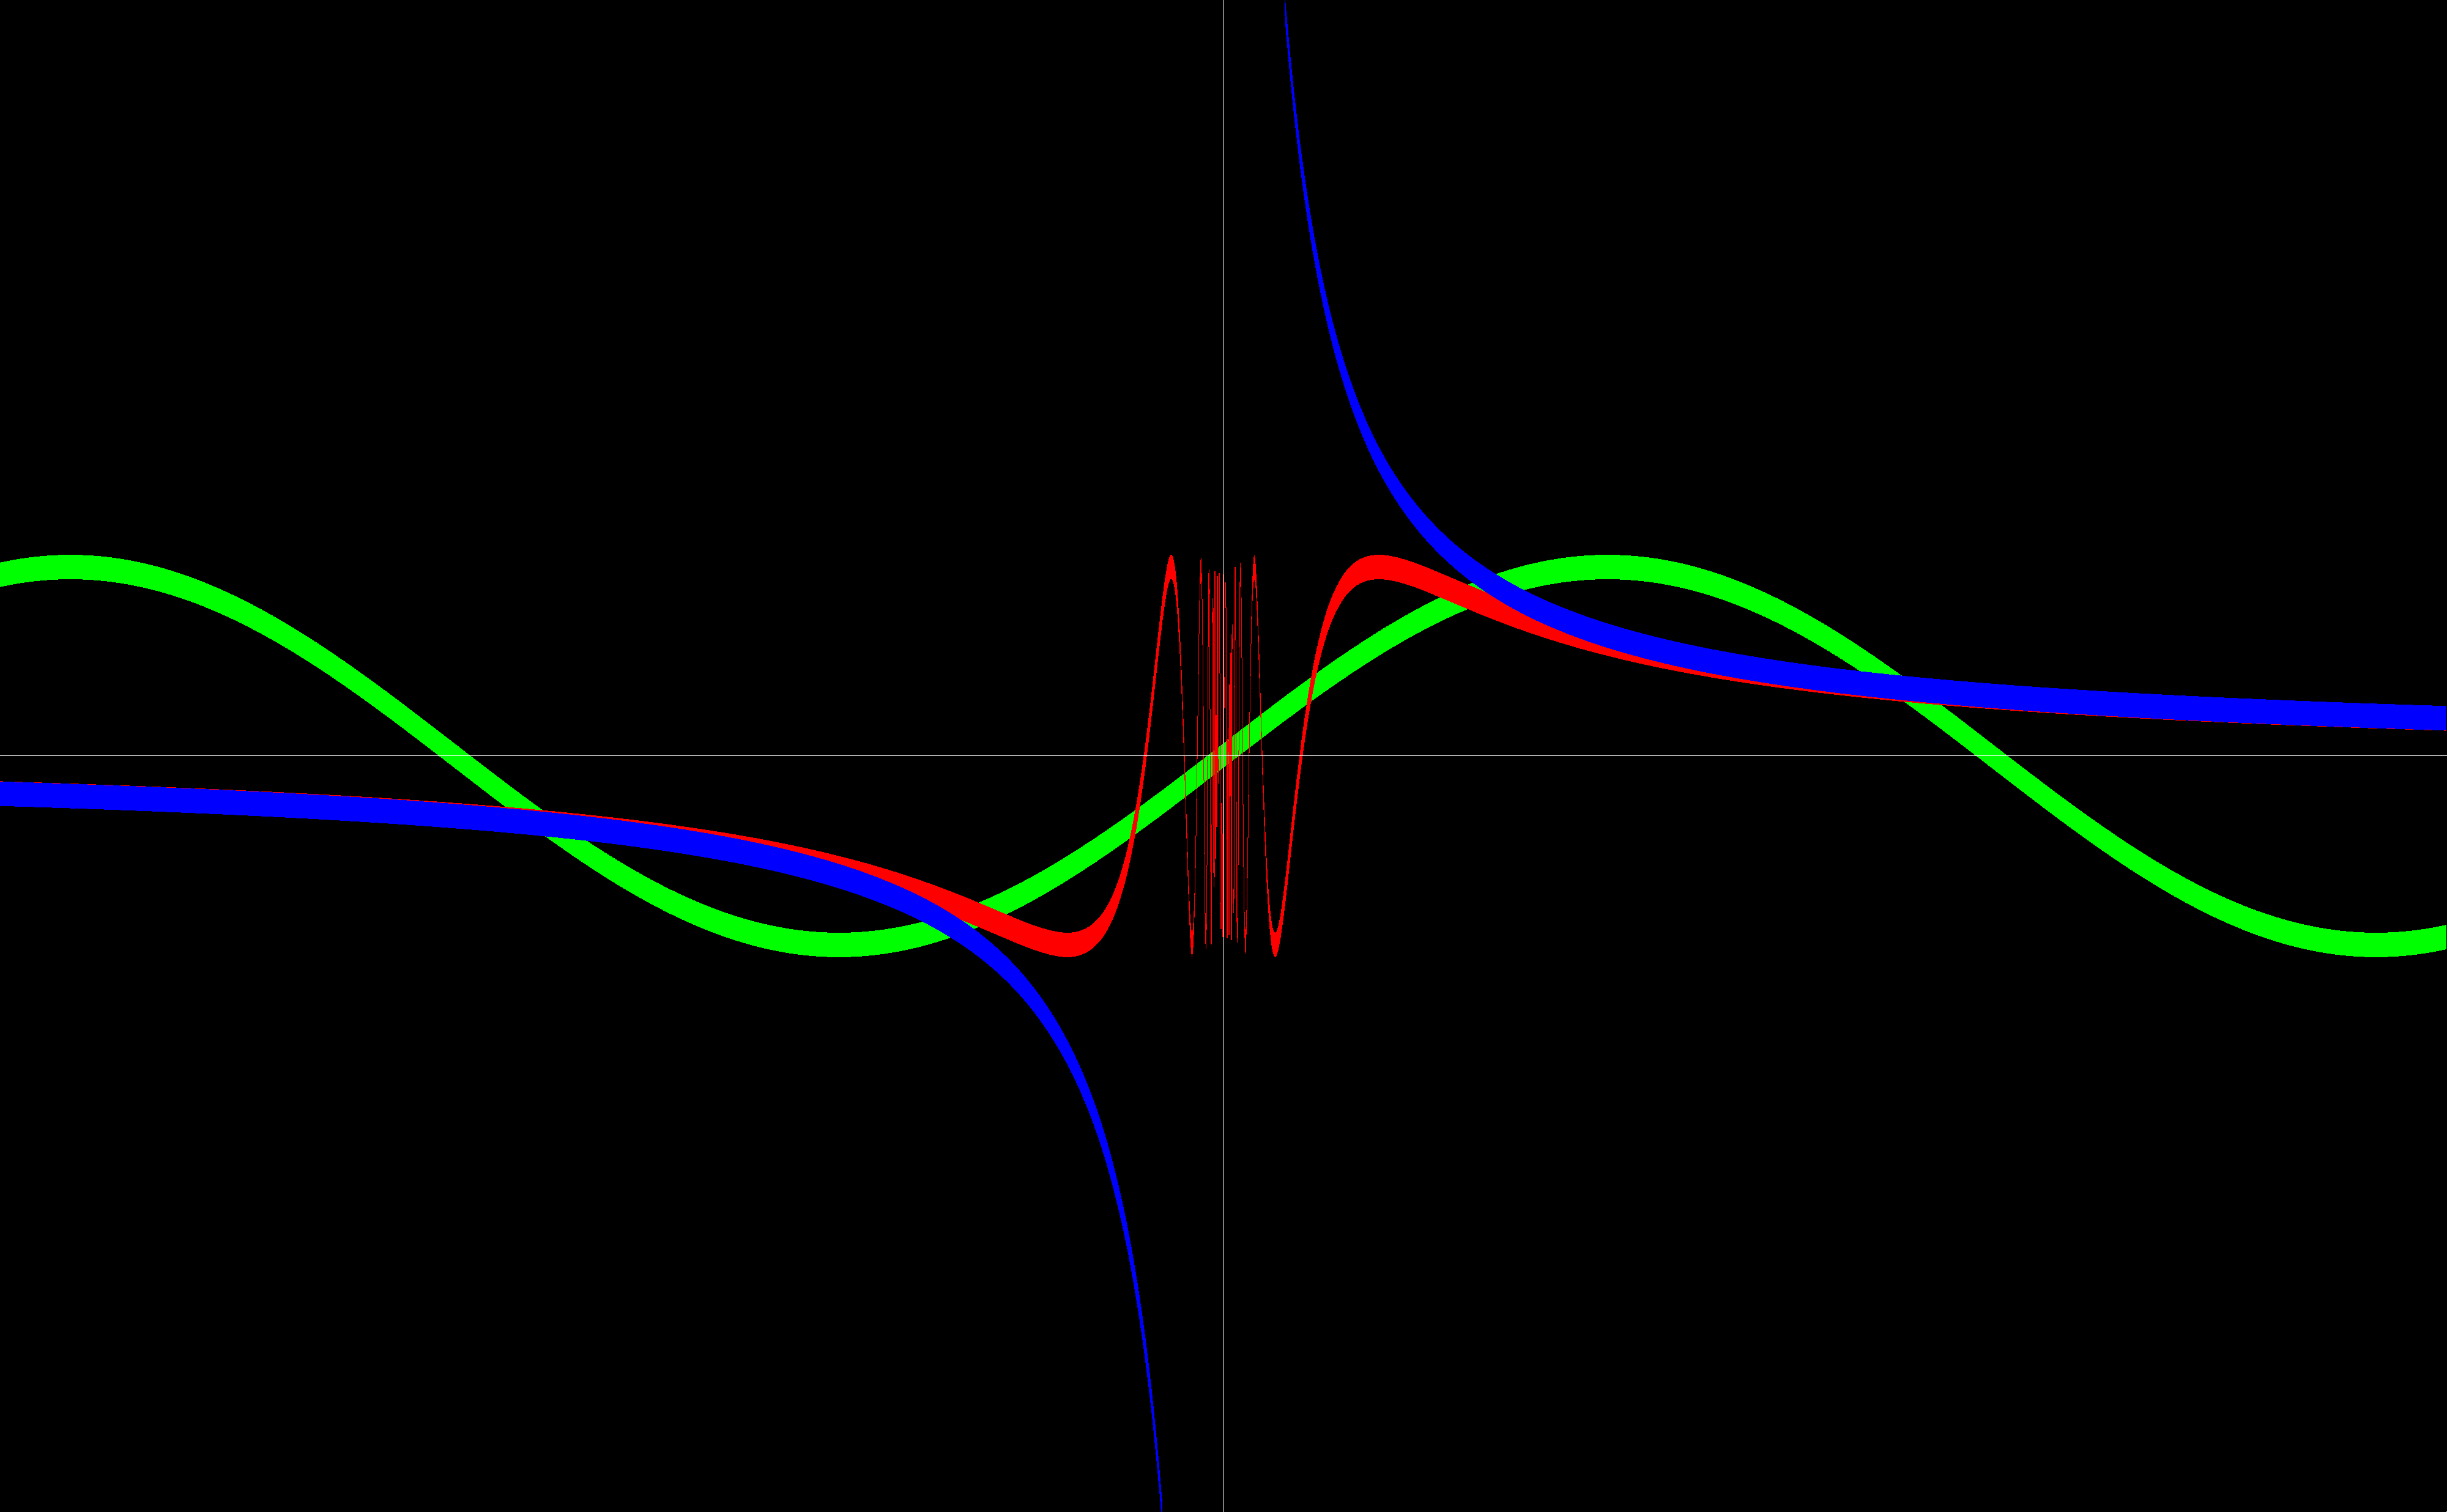
When the function is constant, this is easy: Just add the requisite number of pixels above and below the correct pixel. However, as $f'(x) \to \infty$, that gets weird. You still mark above and below the correct pixel, but then the graph appears thin. Here's an example, which I've made comically thick for emphasis:
The function $\sin(x)$ is pretty much uniformly thick, but $1/x$ gets really thin as $x\to 0$, and so does $\sin(1/x)$.
What can I do to get these graphs uniformly thick?
If I assume I can use automatic differentiation on $f$, does the problem have a more interesting solution?
Note: I tried setting the line thickness at point $x$ to $$ t(x) = t_{\mathrm{user}}\max(1, |f'(x)|) $$ where $ t_{\mathrm{user}}$ is the user requested thickness. But of course $|f'|$ can diverge, so this did horrible things to the graph. So I did: $$ t(x) = t_{\mathrm{user}}\min(\max(1, |f'(x)|), 8) $$ which also looked terrible, though admittedly less terrible than before. But it's just too arbitrary, so asking the hive-mind it is.
Edit: I'm now thinking that the width should be marked along the normal to the tangent, i.e. the line $$ y - f(x_i) = -\frac{1}{f'(x_i)} (x-x_i), $$ not along a vertical. So automatic differentiation is required?
Edit 2: You can get the derivative in pixel space via finite differences; that's just fine, and I image cheaper. Then it's Bresenham's line algorithm + some alpha decay with distance from the curve?

The function sin(x) is pretty much uniformly thickit's not uniform at all, you would notice this better if you used a higher frequency $\endgroup$sin(x)in your screenshot, it's not uniform. The thickness around 0 is around 25% thinner. $\endgroup$