1
$\begingroup$

In my class I often need to work with color map images. I would show the image and try to make inferences/observations about different subjects. Often times I need to actually quantify some aspects, but it is always very approximate and somehow vague because the images are provided "as is" and I do not necessarily know their content a priori.

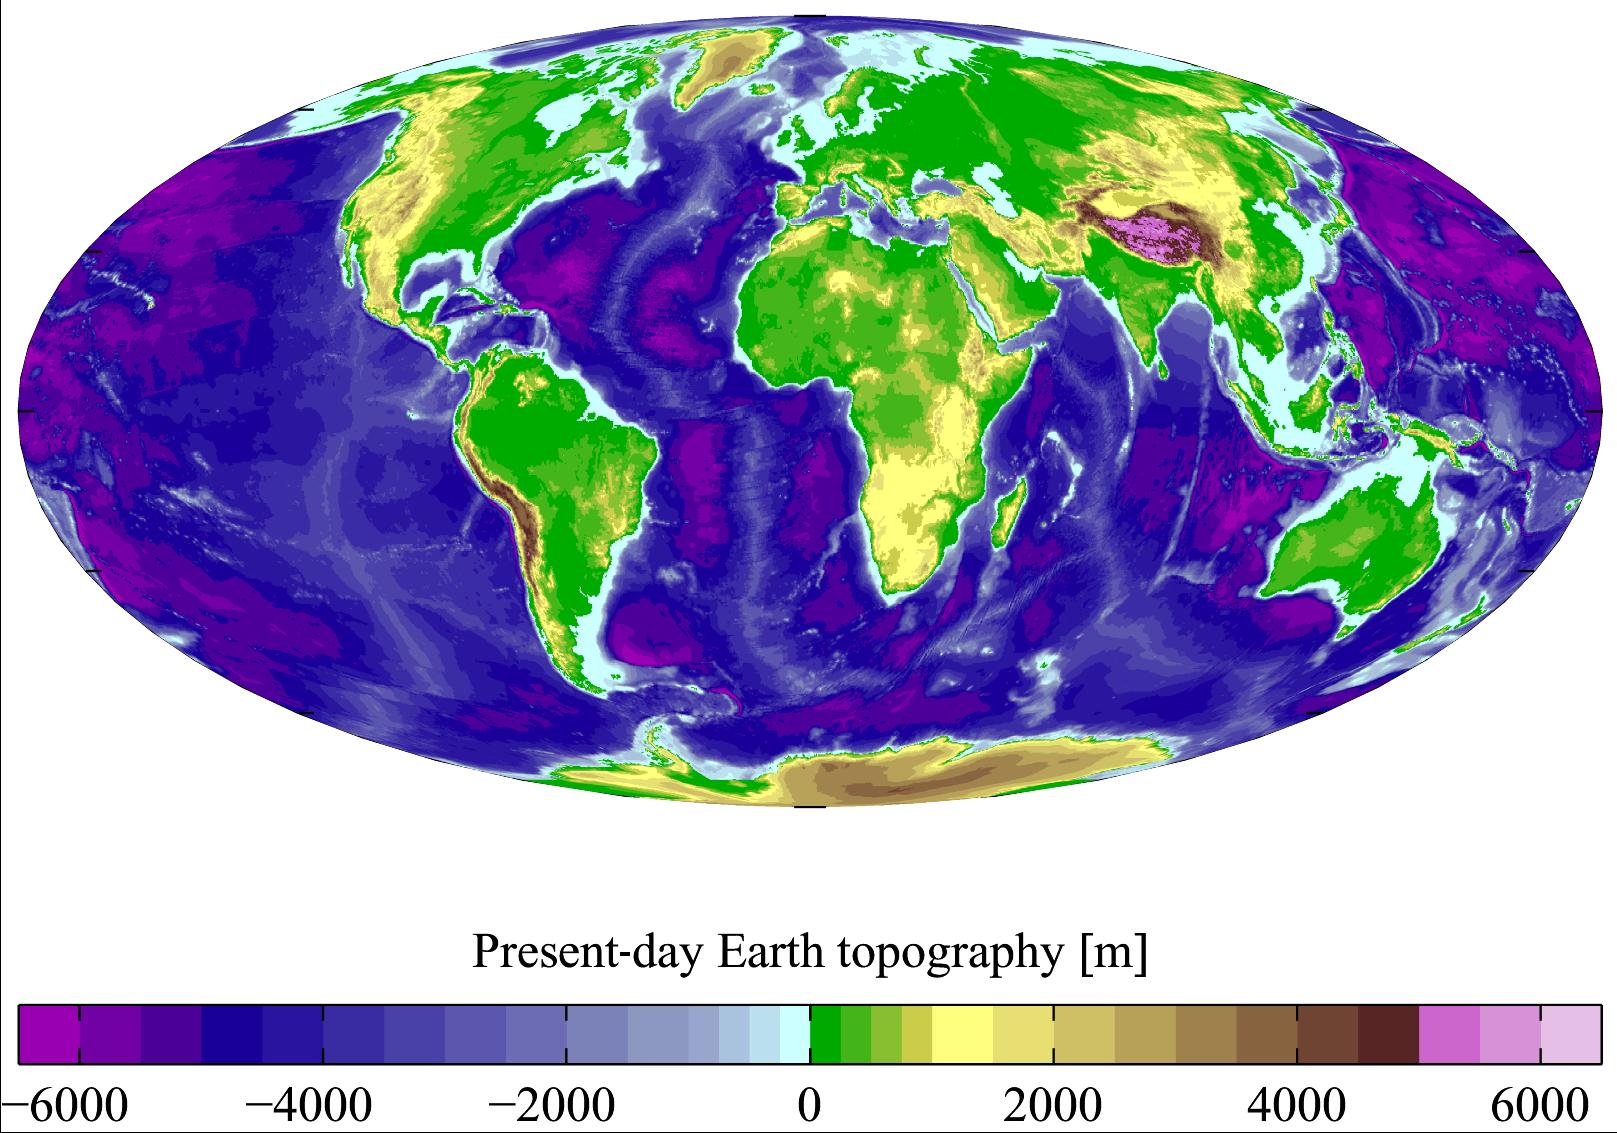
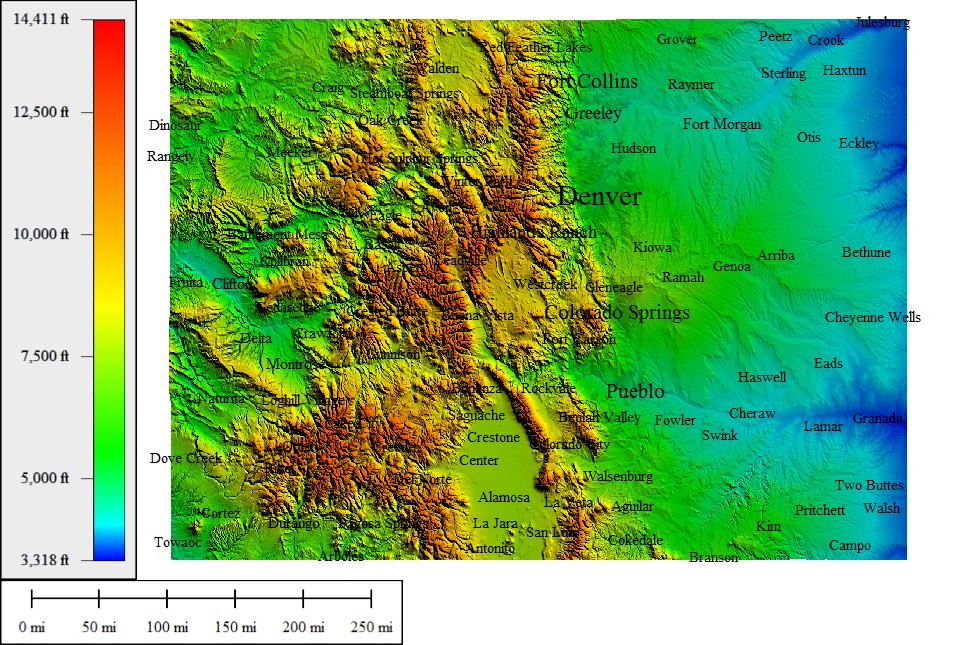
Let's imagine I'm working with two images (*). Is it possible to indicate the computer "learn" the color scale bar so I can click at any point in the map and get the value of altitude at that point? Image 1 is a discrete color scale bar, while Image 2 has a continuous color mapping. I included both examples because maybe there are differences in the approach of how to do this.

So, is there a software/way to do this? Preferably open source. I tried ImageJ and couldn't come up with a decent solution.

Image 1: enter image description here

Image 2: enter image description here

As you can see, the color scale is part of the image in all cases.

(*) I do not own any of these images, just examples I found online to illustrate my point.

$\endgroup$
6
  • $\begingroup$ How much manual effort do you want to put in? For example, would it be okay if you had to specify the (x,y) coordinates of the start of the color scale and the (x,y) coordinates of the end of the color scale, and manually input the numeric values? Or are you hoping for an Artificial Intelligence solution that could potentially 1) Find the legend, 2) OCR the labelling and hash marks, 3) determine an appropriate function (potentially non-linear) to map the colors to values, 4) deal with non-data in the image, such as labels. $\endgroup$
    – Wyck
    Commented Jan 30, 2018 at 17:52
  • $\begingroup$ Wyck, thanks for your answer. I'm willing to put lots of efforts to prepare my classes. And yes it would be totally OK if I had to specify the coordinates of the start and end of the color scale and manually input the numeric values. Keep in mind I'm not searching for a software which takes hundreds of maps and automatically converts to data, I only need to get numbers from a few maps per year (eg 30). So no, I am not looking for the AI approach you mention. $\endgroup$
    – terauser
    Commented Jan 31, 2018 at 13:41
  • $\begingroup$ All I want is to be able to do one, or maybe two things: 1) click at any point in the image and get the value corresponding to that particular color and maybe 2) measure the area covered by any particular color (by user input). $\endgroup$
    – terauser
    Commented Jan 31, 2018 at 13:43
  • $\begingroup$ I know there are programs (and have used them) to digitize plots (eg a XY plot from a JPG): you click at the beginning and at the end of each axis and input the corresponding values. Then you click on each data point and the program automatically gives you the X,Y coordinate of each data point. I was hoping to find something like this, does it make sense? $\endgroup$
    – terauser
    Commented Jan 31, 2018 at 13:53
  • $\begingroup$ I don't know of a software package that provides this kind of lookup functionality out-of-the-box. But as a developer of graphical software, I'm inclined to write it from scratch. Or if you need help implementing a specific operation, then ask for specific help. Or create an open source project on GitHub and I'll contribute. :) Reynold's answer is on the right track for the technique. $\endgroup$
    – Wyck
    Commented Jan 31, 2018 at 15:13

2 Answers 2

1
$\begingroup$

I don't know of any software that could do this for you. However, it should be possible to reverse engineer the colour map to create a kind of look-up table structure.

First, take a one pixel wide column (or row) of the colour map and store this as an array of colour values. Then, create a secondary array, for the data/altitude values, of the same length. Try to mark to the best of you ability the marked values of the colour map on this second array. A simple solution would be to also take a pixel wide column (or row) featuring the markings of the colour map to get the exact one-to-one pixel correspondence. Now you have a secondary array containing the marked off values and the rest of the values can be filled in by figuring out the step size of the colour map. The step size would be the difference in absolute value between subsequent markings divided by the number of pixels between these same markings.

Now when you read a colour from the mapped figure you can look up the colour in the colour array and use the index of this value to look up the altitude in the secondary array.

$\endgroup$
3
  • 1
    $\begingroup$ you can get into trouble if compression artifacts crop up though $\endgroup$ Commented Jan 31, 2018 at 9:11
  • $\begingroup$ Indeed, this technique would not be very robust in presence of artefacts. Although, the colour look up could be relaxed to find the nearest match instead of an exact match. In any case it remains an approximation. $\endgroup$
    – Reynolds
    Commented Jan 31, 2018 at 9:54
  • $\begingroup$ Thanks, I'm aware of the artifacts introduced by lossy formats like JPEG. However for my classes I am not interested in retrieving "pure", real, accurate data but rather I take my map (jpg) as the "truth" and work from there. For my purposes this is enough. Otherwhise I would not even bother. All I care is that a given RGB value equals some quantity (eg elevation) within a given image. For example, I won't be comparing two JPG. I only work with one image at the time, and only when the scale color bar is part of the image. $\endgroup$
    – terauser
    Commented Jan 31, 2018 at 13:48
1
$\begingroup$

I took a few days and wrote something to do this. It was not really as straightforward as I was expecting so I'll share what I learned.

What was hard

Here are the major headaches I encountered.

Dealing with JPEG Compression Artifacts

When sampling the values for the legend, I encountered many JPEG compression artifacts. This required me to apply a median filter. The median filter width needed to be a parameter of the function (needs different values depending on how big the legend is.)

Dealing with "bands" in the legend

The legend in your first example is divided into discrete sections (bands) and the numeric quantity desired is probably the middle of the range that the colour spans. For example, the left-most box covers values from -6500 to -6000 and should probably return "-6250" when trying to sample a single colour of that value. Also, consequently, no pixel will return the value "0". There is no colour representation for "0" (in that first map anyway.)

Dealing with differences in tone / value.

Sometimes the exact colour in the map doesn't exist in the legend, especially due to the text labels, so you have to do a "closest" matching algorithm and the hue seems to be more important than the value (black&white-ness) so it was better to evaluate "distance" between colours in a colourspace other than RGB.

Text overwrites data

There are plenty of black pixels in the map due to the labels, but these need to be ignored somehow. It makes sense to try to infer what the value behind the text is, and only colours that are not in the legend qualify for this kind of inference.

Manually selecting points on the legend is not precise

Each time I eye-balled it and manually found a point that looked like approximately the end-point, I'd choose a slightly different pixel, resulting in slightly different values between attempts. Perhaps a snapping technique would be better where I could "hint" where the legend is, but it would find the high-contrast edge markings and snap the hint point to the exact point.

Most maps don't have continuous legends.

Most other images that I went searching for with test data had discontinuities in their legend (discrete boxes of colour) as opposed to a nice continuous linear gradient like you provided. This makes it extra difficult to automatically come up with the mapping from colour to value just by analyzing the positions of the colours in the legend. I was disappointed when trying to apply it to most maps.

Visualization tips

It was very useful (especially while debugging) to visually show the point on the legend that it thought best corresponded to the colour being picked in the map.

Persistence

It's useful to persist the location of the endpoints of the linear gradient portion of the legend and the values that are associated with them between runs of the application. Don't underestimate the value of this. It's annoying to have to specify all that stuff every time.

What worked well

Represent the legend as all the pixels along a line segment

Specify two (x,y) locations of the start and end of a linear gradient (the legend) and manually define the values that are associated with them.

build up a discrete sample set for the gradient

Sample all the pixels in between the start and end points to build a linear gradient dataset.

Median filter

Apply a median filter to the linear gradient dataset to filter out JPEG noise.

Quantize the dataset to locate centroids

Optionally filter out bands (long runs of samples in the linear gradient dataset that have approximately the same colour) and replace them with a single sample at the centroid (average position).

Use bilinear sampling when picking a pixel

Pick a pixel in the map and perform a bilinear sample to smooth out pixellation. This seems to help improve the smoothness and resolution of the map.

Linear search is fine

Linearly search for the data point in the linear gradient for the closest colour. For an interactive picker working from mouse clicks, you have lots of time to perform a linear search. No fancy hashing, indexing or optimized searching was required.

Hue is important in the colour distance function

Compare distance between colours using a distance function in a colourspace that tolerates brightness difference more than hue difference. (like YUV, for example)
$\endgroup$

Your Answer

By clicking “Post Your Answer”, you agree to our terms of service and acknowledge you have read our privacy policy.

Not the answer you're looking for? Browse other questions tagged or ask your own question.