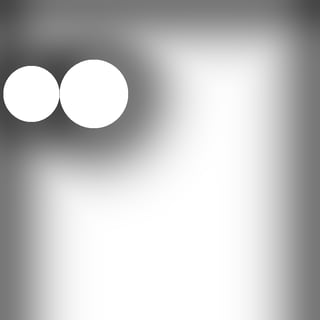
Intuitively, dust settles onto surfaces at a higher rate in areas where the air flow is slower. This means instead of a surface gathering an even layer of dust, there will be more in corners - corners of a room/shelf, corners formed by the placement of objects on a surface, concavities in a surface.
I can get an increase in realism simply by making the thickness/density of dust reduce with distance from an object, and combine that effect for several objects including walls. This naturally gives the expected ordering of thicknesses - the edges of a floor have more dust than the centre, the corners where the edges meet have more dust then the centre of the edges. However, the increase in realism from getting the order correct still leaves the problem of getting the ratio right. There is more dust in the places you expect to have more dust, but not necessarily the right amount more.
Is there an established method of approximating a realistic ratio of thickness between different points on a surface? I don't need this to be completely physically accurate (that would need to take into account objects that move through the environment during the long period taken for dust to accumulate). I'm just looking for average behaviour that will look believable to the human eye.
In searching online I've mostly found atmospheric models for suspended dust, rather than a way of modelling dust deposition on a surface.
My attempts - linear and exponential distributions
Here is some code in Python 3 using pillow (the PIL fork) that demonstrates a couple of distributions I have experimented with:
from PIL import Image
from math import exp


def linear(distance, scale):
    return max(0, 64 - distance * scale)


def exponential(distance, scale):
    return 64 * exp(-distance * scale)


def exponential_squared(distance, scale):
    return 64 * exp(-distance * distance * scale)


def gamma_corrected(value):
    corrected_value = int((value/255)**(1/2.2)*255)
    return corrected_value


def produce_image(image_size=(1024,1024),
                  glasses=(((100,300),90),((300,300),110)),
                  distribution=exponential,
                  scale=0.1,
                  background_level=0,
                  gamma=2.2,
                  filename='dusttest.png'
                  ):
    width, height = image_size
    pixels = []
    for y in range(height):
        for x in range(width):
            red, green, blue = pixel_value(x, y, image_size, glasses,
                                           distribution, scale,
                                           background_level
                                           )
            pixels.append((red, green, blue))

    image = Image.new('RGB', image_size, color=None)
    image.putdata(pixels)
    image.save(filename)


def pixel_value(x, y, image_size, glasses, distribution, scale,
                background_level
                ):
    width, height = image_size
    value = background_level
    value += distribution(x, scale)
    value += distribution(width-x, scale)
    value += distribution(y, scale)
    for glass in glasses:
        coords, radius = glass
        a, b = coords
        distance = ((x-a) ** 2 + (y-b) ** 2) ** 0.5 - radius
        if distance < 0:
            value = 0
            break
        value += distribution(distance, scale)
    value = 255 - gamma_corrected(value)
    return ((value, value, value))


if __name__ == '__main__':
    for scale in [0.1, 0.2, 0.4, 0.8]:
        produce_image(distribution=linear,
                      scale=scale,
                      background_level=20,
                      filename='linear-' + str(scale) + '-dusttest.png'
                      )
    for scale in [0.1, 0.05, 0.03, 0.01]:
        produce_image(distribution=exponential,
                      scale=scale,
                      background_level=0,
                      filename='exponential-' + str(scale) + '-dusttest.png'
                      )
    for scale in [0.01, 0.001, 0.0001, 0.00001]:
        produce_image(distribution=exponential_squared,
                      scale=scale,
                      background_level=0,
                      filename='exponential-squared-' + str(scale) + '-dusttest.png'
                      )
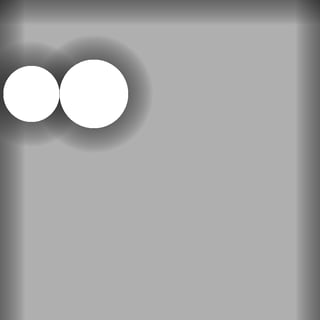
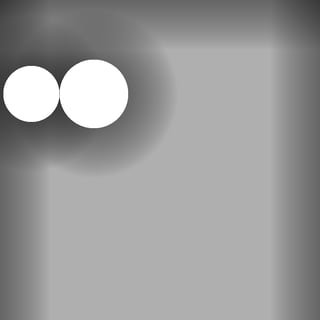
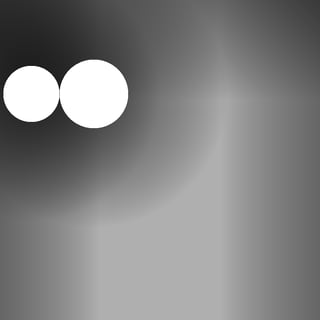
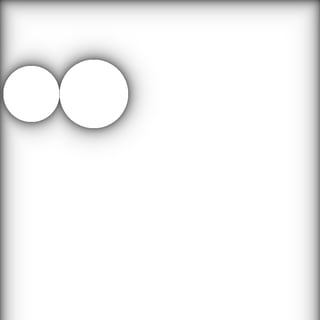
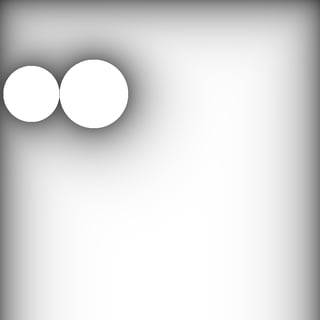
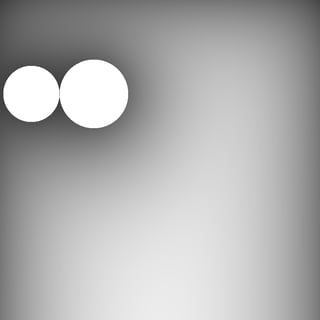
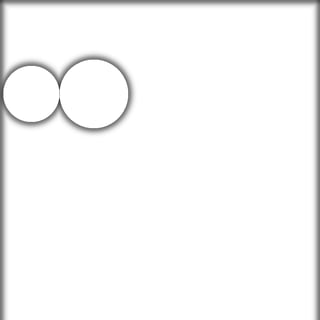
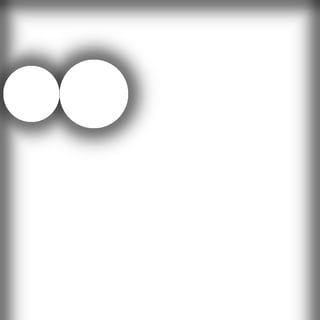
Imagine looking down from above on a white shelf that has had drinking glasses placed on it. Some time later the glasses are removed to leave dust free circular regions and a distribution of dust over the rest of the shelf. The dust is affected by the positions of the glasses and the back and side walls. The front of the shelf (bottom of the image) is open, with no wall to increase dust.
Output
(Click for larger images)
Linear reduction in dust density plus constant background level of dust:
Exponential reduction in dust density (zero background level):
I expected the exponential version to be closer to reality, and I prefer the result visually. However, I still don't know if this is close enough.
Following Alan Wolfe's suggestion of the normal distribution, I've also added images using exp(-distance ** 2) at a variety of scales.
I quite like this too, but I still couldn't guess which of this and exponential (exp(-distance)) is best.
I'm looking for feedback in two ways:
- Do any of these distributions look right/natural to you? I want input from a wider range of human eyes, ideally with specific problems/inconsistencies.
- Is there a physical interpretation that would justify using one of these distributions, or that would suggest a better one?
