15
$\begingroup$

In my answer about Affine Transformations I made some little illustrations to help the explanation.

How do you make an upload-able PNG quickly which expresses a geometrical or mathematical idea?

This question was contrived to support my postscript answer but is intended to solicit other solutions that may benefit the SE network more generally. But for credibility, an answer must link to a post where this technique has in fact been used, as well as a sufficient "howto" portion if it involves more than something obvious like "Select export from menu".

There are two meta questions here and here concerning how to scope this question in light of the precedences it may set for our site.

$\endgroup$
9
  • 2
    $\begingroup$ I personally see this question more on PostScript than it is on computer graphics. $\endgroup$
    – cifz
    Commented Sep 2, 2015 at 7:45
  • 1
    $\begingroup$ @cifz right this would fit GD.SE better. But thats not a reason why it can not be here. $\endgroup$
    – joojaa
    Commented Sep 2, 2015 at 19:12
  • $\begingroup$ @citz I think I see what you mean. What if I take it out of the question, and open it up for tikz and asymptote and whatnot. $\endgroup$ Commented Sep 2, 2015 at 21:20
  • $\begingroup$ I am answering here to show that this is a bit opinionated as a question, and answers definitely will be. Maybe this entire thread should live in our Meta, like this does on GD.SE. Any thoughts, @cifz $\endgroup$
    – joojaa
    Commented Sep 3, 2015 at 10:15
  • 1
    $\begingroup$ Meta question concerning this question. $\endgroup$ Commented Sep 3, 2015 at 22:09

6 Answers 6

13
$\begingroup$

I use a variety of tools depending on the particular needs of the moment. I have a bias toward free tools, as I don't have access to things like Illustrator or Mathematica.

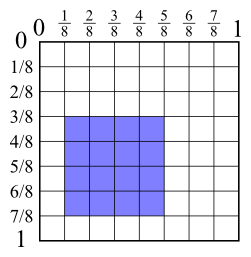
For general vector art purposes I use the free Inkscape. It operates on .svg files and can also render them out as high-quality .pngs or other bitmap formats. For example, here's a diagram I made in Inkscape to explain UV mapping:

For 2D function graphs, I often use the online graphing calculator Desmos, which has the handy capability of letting you share graphs online so others can view and modify them. You can also create sliders that can be varied to play with curve parameters in real time. For example, here is a configurable sharpening function.

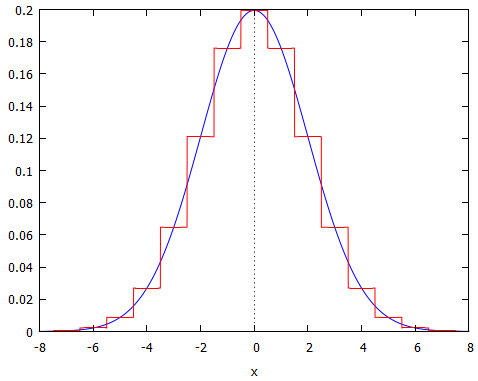
For more complex graphing tasks that involve a bit of programming, I use Maxima, a free computer algebra system that also has graphing features. I used Maxima to create the graphs in this answer about Gaussian blurs:

This was a bit too complex for Desmos, since it involved programmatically creating a piecewise approximation of a Gaussian.

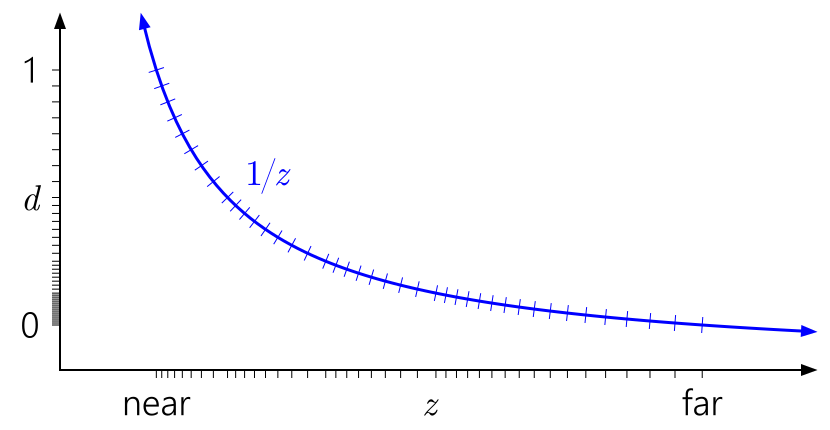
For really odd graphing tasks that aren't handled well by anything else, I've used Python with the svgwrite package to programmatically generate diagrams into .svg files. These can then be touched up in Inkscape if desired and rendered to bitmaps using Inkscape or ImageMagick. I used that workflow to create the images in this blog post on depth precision, like this:

In this case I wanted to not only graph a function, but place tick marks programmatically and nonuniformly along both the axes and the graph, to illustrate discrete depth buffer values.

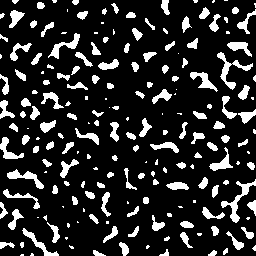
And finally, if nothing else suffices, I'll use Python with numpy and pillow to render images pixel-by-pixel. That's how I created the Perlin noise images in this answer (with the help of the noise package too, in this case).

$\endgroup$
1
  • $\begingroup$ Nathan you are the one that wrote that about depth precision? Wow cool... i read that thing and it helped a lot! small world :P $\endgroup$
    – Alan Wolfe
    Commented Sep 3, 2015 at 23:03
12
$\begingroup$

Personally my choice of poison is Adobe Illustrator. Other apps such as inkscape, Corel Draw, Xara Designer will also do. In a pinch even PowerPoint will work. Though I do not personally recommend PowerPoint due to severe issues with its data model, even tough is possibly worlds most deployed drawing app.

It can also be a good idea to have a graphing application at hand. I personally use Mathematica for this although many other apps would work too. Or if you want you can use Wolfram alpha that's a free online version of mathematica.

Disclaimer: Because examples are mine and shameless self endorsement take with a pinch of salt.

Illustrator

The first thing you should do in any vector drawing app is to enable the snapping grid. This reduces the tediousness of accurately placing lines. One of the big reasons i do not like to use Inkscape is the inferior way it implements this snapping. PowerPoint actually comes with grid snapping on by default.

I am not really satisfied by Illustrator as it does not fill all my needs. But no software so far does (Maya used to fill this niche but then autodesk happened).

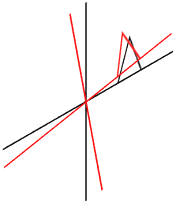
The second reason i choose Illustrator is that it understands postscript natively. So if i need to program something i can do so quickly and existing documents update as my code matures Image 3 is done this way.

  • Resource showing snap, postscript and java script access to illustrator and links forward.

Here are some examples of drawings that I have done across the network with Illustrator, mostly by power of grid snap:
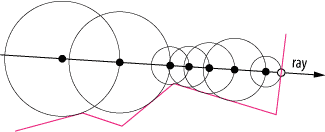
Circle march

Image 1: One of many images i drew in illustrator on this site. Note: I am a quite experienced Illustrator (sometimes commercial) and this is extremely simple by my standards.

The Circle march image in is fairly simple to do. Just draw a random shape by clicking around. After this disable snap and let the smart guides do your work for you. Draw lines to closest point on the line, make circles to the line and (i deleted the guide lines after i was done). Rinse and repeat. It took me about 3-5 minutes to draw the image once i got my workspace started.
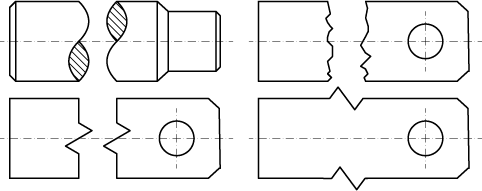
Continuation wave

Image 2: GD.SE Continuation wave.

While this image seems quite more elaborate, its not much more work than the first image. It is more technical so in addition to grid snap I and now using the shift key to constrain lines to 45 degree angles. Hatch fills are easily just assigned to regions with the shape builder tool of illustrator. (example of shape builder in use, screen capture)
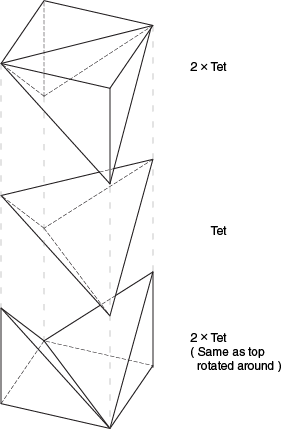
tetra image

Image 3: Sometimes its easier to start from scratch in postscript. Image added to post on ENG.SE.

Finally a image that really is easier to do by typing the values in postscript. It is relatively easy to do in postscript. Ive still done the typography in illustrator. While drawing this by hand is not a big deal i prefer not to, but i will do it if i must do judgement call by eye.

Mathematica

Mathematica is wonderful if you want to explore things a bit more. The only drawback to Mathematica is that it is NOT cheap. But it can do nearly anything quickly. Ive used Mathematica for some of my pictures on of nurbs basis.

One of Mathematicas core competencies s that its easy to develop even fairly complex pictures without much hassle. It can also easily animate your simple picture within you editor.

Graphics[{
    orig = {
        Table[
            GeometricTransformation[
                Line[{{0, 0}, {50, 0}}],
            RotationTransform[ang]],
            {ang, 0, 3 Pi/2, Pi/2}
        ],
        Line[{{20, 0}, {30, 20}, {40, 0}}]
    },
    Red,
    GeometricTransformation[
        orig,
        RotationTransform[Pi/6]
    ]
}]

Results in same picture as others have. Wrapping it inside a table as per results in:
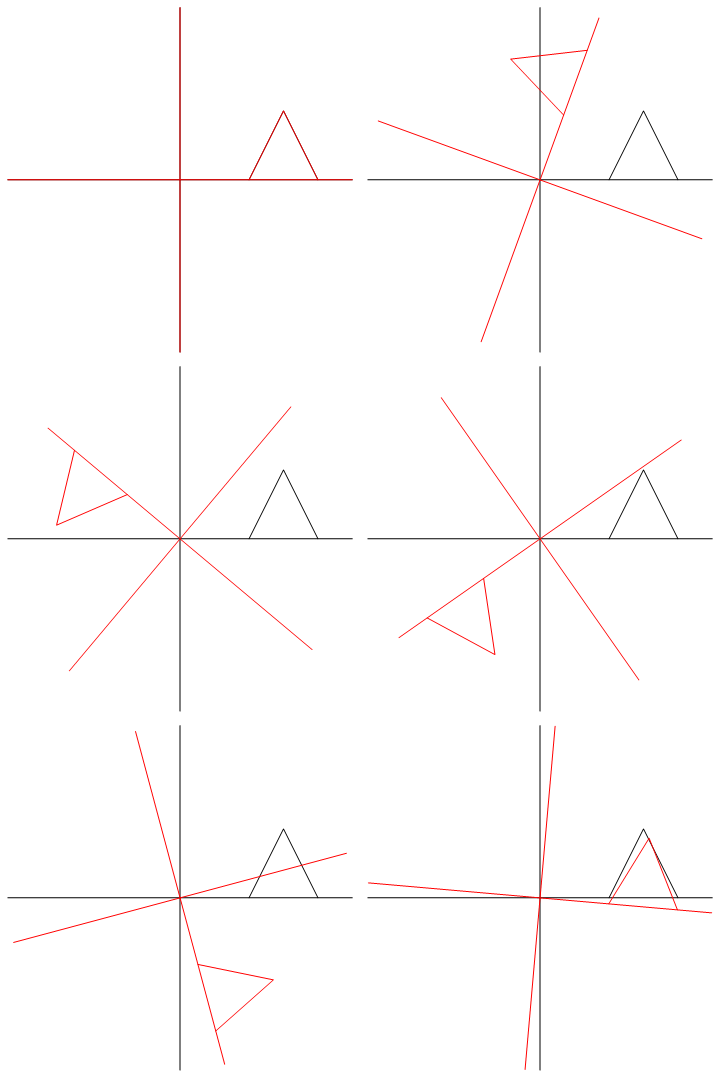
enter image description here

Image 4: Animation is simple to do inside the code editor using Mathematica.
$\endgroup$
6
  • $\begingroup$ For the PS image, is that an isomorphic projection? Did you calculate the values by hand or do you have a function to do projections? $\endgroup$ Commented May 8, 2020 at 23:10
  • $\begingroup$ @luserdroog i have a function that takes a 3D coorinate and projects it yes. Basizally its a isometrix matrix plus a offset move for z. Why? You need something like that? $\endgroup$
    – joojaa
    Commented May 9, 2020 at 9:28
  • $\begingroup$ I was re-reading the answers here because I needed to make some diagrams and flowcharts. Nah, I guess I don't really need a function like that, I was just curious about it. Thanks $\endgroup$ Commented May 9, 2020 at 16:00
  • $\begingroup$ @luserdroog i dont think you would have had problems doing this. Anyway you dont happen to know some simple graph layout algo for the flowcharts. $\endgroup$
    – joojaa
    Commented May 9, 2020 at 16:04
  • $\begingroup$ I don't know about any algorithms, but I think there were quite a few papers from Bell Labs about pic that might be worthwhile. For my task I tried Inkscape but it seemed like I wasn't going to be able to get what I want quickly. I'm now using app.diagrams.net which seems pretty good. $\endgroup$ Commented May 9, 2020 at 16:34
4
$\begingroup$

PostScript+ps2eps+mogrify

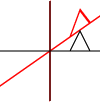
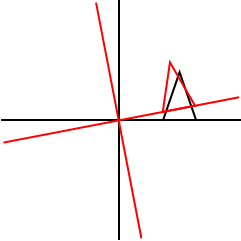
For the Affine Transformations answer, I wrote a very small postscript program and then saved several copies under different names and edited each one to do each different task: scale, translate, rotate. For example, here's the basic one, ident.ps which does nothing to change the coordinates between the red drawing and the black drawing. I made the red lines a little larger and always draw it first, so the two show up nicely superposed and visible (IMO). I previewed with ghostscript with the vi (ex) command :!gs %. (all source files)

%!
/axis {
    currentpoint 4 { 
        2 copy moveto
            50 0 lineto
            90 rotate
    } repeat pop pop 
} def 
/shape {
    20 0 moveto
    30 20 lineto
    40 0 lineto
    closepath
} def 

100 100 translate

gsave
% do transform here
currentlinewidth 1.5 mul setlinewidth
1 0 0 setrgbcolor
0 0 moveto axis shape stroke
grestore

0 0 moveto axis shape stroke

showpage

I then used the ps2eps command from psutils to calculate bounding-boxes automatically

$ ps2eps -f *.ps
Input files: ident.ps rotate.ps scale.ps skewx.ps skewy.ps translate.ps
Processing: ident.ps
Calculating Bounding Box...ready. %%BoundingBox: 50 50 150 150
Creating output file ident.eps ... ** Warning **: Weird heading line -- %! -- ready.
Processing: rotate.ps
Calculating Bounding Box...ready. %%BoundingBox: 50 50 150 150
Creating output file rotate.eps ... ** Warning **: Weird heading line -- %! -- ready.
Processing: scale.ps
Calculating Bounding Box...ready. %%BoundingBox: 25 25 175 175
Creating output file scale.eps ... ** Warning **: Weird heading line -- %! -- ready.
Processing: skewx.ps
Calculating Bounding Box...ready. %%BoundingBox: 50 49 150 151
Creating output file skewx.eps ... ** Warning **: Weird heading line -- %! -- ready.
Processing: skewy.ps
Calculating Bounding Box...ready. %%BoundingBox: 49 50 151 150
Creating output file skewy.eps ... ** Warning **: Weird heading line -- %! -- ready.
Processing: translate.ps
Calculating Bounding Box...ready. %%BoundingBox: 50 50 165 165
Creating output file translate.eps ... ** Warning **: Weird heading line -- %! -- ready.

And finally used imagemagick's convert command to produce cropped png images. (I didn't think of a quick way to automate this part. Edit: as commented, this can be done with mogrify -format png *.eps. Thanks, joojaa!)

$ convert ident.eps ident.png

josh@cadabra ~/affine
$ convert scale.eps scale.png

josh@cadabra ~/affine
$ convert rotate.eps rotate.png

josh@cadabra ~/affine
$ convert skewx.eps skewx.png

josh@cadabra ~/affine
$ convert translate.eps translate.png

josh@cadabra ~/affine
$ convert skewy.eps skewy.png

Which produces PNGs, ready to upload.

$ ls -l *.png
-rw-r--r-- 1 josh None  587 Sep  1 21:16 ident.png
-rw-r--r-- 1 josh None 1431 Sep  1 21:21 rotate.png
-rw-r--r-- 1 josh None  798 Sep  1 21:19 scale.png
-rw-r--r-- 1 josh None 1133 Sep  1 21:22 skewx.png
-rw-r--r-- 1 josh None 1197 Sep  1 21:23 skewy.png
-rw-r--r-- 1 josh None  756 Sep  1 21:23 translate.png

$\endgroup$
2
  • $\begingroup$ I dont really see the point of generating the encapsulation with ps2eps cant you just type the eps header in your template. It makes the instruction cleaner (and user needs less dependenies). Instead of converting each file separately do mogrify -format png *.eps $\endgroup$
    – joojaa
    Commented Sep 2, 2015 at 9:43
  • $\begingroup$ Cool. I didn't know about mogrify. For the ps2eps part, it automatically calculates (and adds) the bounding-box info. Omitting that part, convert will produce full-page-sized images $\endgroup$ Commented Sep 2, 2015 at 20:48
4
$\begingroup$

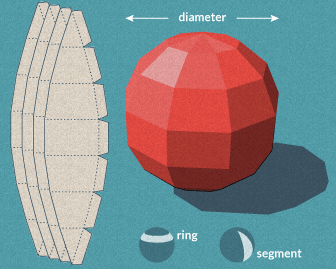
I just use Powerpoint to make such diagrams and it works great as soon as you're comfortable with its basic primitives. It supports all simple operations like rotation, translation, etc. and recent revisions also have shear and 3D transforms. Examples:

enter image description here

enter image description here

Here is an example of a Powerpoint diagram I made for an answer.

For more complicated diagrams, especially in 3D, I sometimes use Blender with shadeless materials. I can elaborate and show examples if it is relevant to your question.

Looks like jsfiddle is also popular around here.

$\endgroup$
3
  • $\begingroup$ I agree---my answer is likely not valid any more because I haven't used diagrams in any answers so far. But I expect that to happen soon. So if it's OK for this answer to hang around for a few days, I am sure I will be able to find an answer. $\endgroup$
    – ap_
    Commented Sep 8, 2015 at 19:04
  • $\begingroup$ Done! My answer should be valid now. $\endgroup$
    – ap_
    Commented Sep 13, 2015 at 18:24
  • $\begingroup$ Excellent. Deleting my earlier comments. $\endgroup$ Commented Sep 13, 2015 at 19:44
4
$\begingroup$

Not the definitive toolbox you might be looking for, but just an extra tool I use myself: for 3d graphics, Blender might come in handy. Especially if you use the Export_SVG plugin (available from http://dl.dropbox.com/u/16486113/Blender/archivos/temp/SVG/export_svg.py and http://blenderartists.org/forum/showthread.php?282824-SVG-output-script )

This allows you to get Blenders 3d objects as vector graphics in Illustrator or Inkscape. I find it gives me a nice quick start for creating simple 3d illustrations.

Allow me to paste an example. (In this example I use a lot of colors, but ofcourse, it can be all made black-and-red-on-white instead)

enter image description here

$\endgroup$
1
  • $\begingroup$ surely you mean illustrator and inkscape (instead of illustrator and illustrator) $\endgroup$
    – joojaa
    Commented Sep 16, 2015 at 8:10
1
$\begingroup$

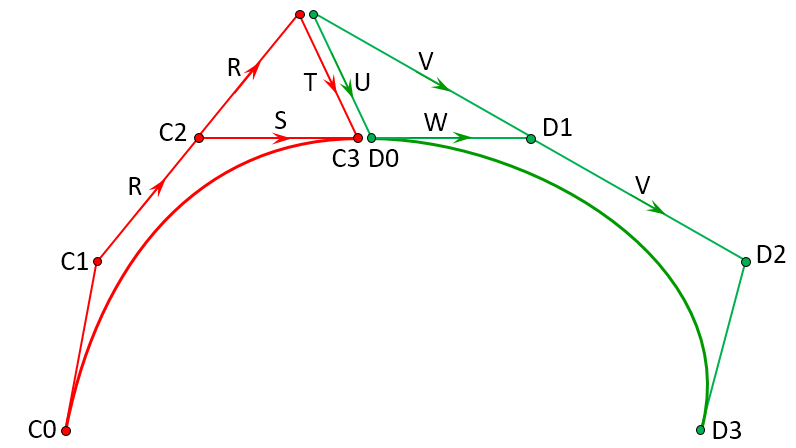
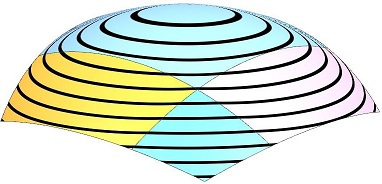
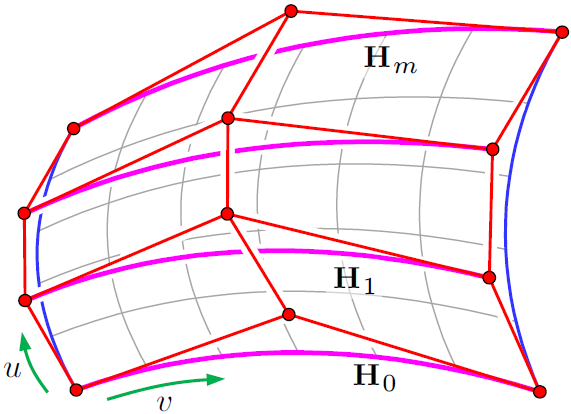
I use Powerpoint and various (expensive) CAD packages. I wrote Powerpoint macros (VBA code) to do some special things like draw the control polygons of Bezier curves. Then I use the standard Windows Snipping Tool to grab screen shots. Here are some examples:

enter image description here

enter image description here

enter image description here

enter image description here

And some further examples from Math.SE

One
Two
Three
Four
Five

$\endgroup$
3
  • $\begingroup$ Powerpoint is actually quite expensive considering things. Its ok, after all drawing skill comes from you. But atleast tikz, inkscape, blrnder and postscript are way cheaper than powerpoint. $\endgroup$
    – joojaa
    Commented Nov 1, 2017 at 5:38
  • $\begingroup$ I'm old, so time is more important to me than money. Inkscape is good, but there's no way I'd spend time writing tikz or Postscript code to produce pictures. $\endgroup$
    – bubba
    Commented Nov 1, 2017 at 12:47
  • 1
    $\begingroup$ You don't need to take a screenshot, you can export the result to pdf (or EMF) formats, and then open it in something like inkscape to export it to a PNG with the resolution of your choice. $\endgroup$
    – s.ouchene
    Commented Aug 28, 2020 at 18:29

Your Answer

By clicking “Post Your Answer”, you agree to our terms of service and acknowledge you have read our privacy policy.

Not the answer you're looking for? Browse other questions tagged or ask your own question.