added scalar explanation; added 28 characters in body
Source Link

If we want to be able to control our step value, we can multiply it by a scalar ($a\cdot k$) before taking the logarithm, like so:

$\theta=\frac{\ln (ak\cdot r)}{a}$

Therefore, if we take the natural log of our theta multiplied by the scalar and $a$, then divide itthe whole thing by $a$ before plugging it in to the equation, we will get equally stepped vertices on the logarithmic spiral. Image:

I generated this with some JavaScript code, which you can find in this JSFiddleJSFiddle.)

You can also try it out interactively on DesmosDesmos.

This is because we are sampling the curve in increments that cause equal lengths along the curve, not equal lengths between consecutive points. As the spiral gets bigger and bigger, the curve will get shallower and shallower, so the distances will get closer and closer to each other.
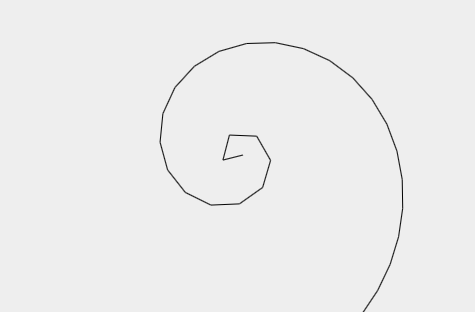
Therefore, if we take the natural log of our theta then divide it by $a$ before plugging it in to the equation, we will get equally stepped vertices on the logarithmic spiral. Image:

I generated this with some JavaScript code, which you can find in this JSFiddle.)

You can also try it out interactively on Desmos.

This is because we are sampling the curve in increments that cause equal lengths along the curve, not equal lengths between consecutive points. As the spiral gets bigger and bigger, the distances will get closer and closer to each other.

If we want to be able to control our step value, we can multiply it by a scalar ($a\cdot k$) before taking the logarithm, like so:

$\theta=\frac{\ln (ak\cdot r)}{a}$

Therefore, if we take the natural log of theta multiplied by the scalar and $a$, then divide the whole thing by $a$ before plugging it in to the equation, we will get equally stepped vertices on the logarithmic spiral. Image:

I generated this with some JavaScript code, which you can find in this JSFiddle.

You can also try it out interactively on Desmos.

This is because we are sampling the curve in increments that cause equal lengths along the curve, not equal lengths between consecutive points. As the spiral gets bigger and bigger, the curve will get shallower and shallower, so the distances will get closer and closer to each other.

added 121 characters in body
Source Link

[![enter image description here][1]][1]enter image description here

I generated this with some JavaScript code, which you can find in this [JSFiddle][2]JSFiddle.)

You can also try it out interactively on Desmos.


This looks good initially, but let's analyze what's going on here a little deeper.

This is because we are sampling the curve in increments that cause equal lengths along the curve, not equal lengths between consecutive points. As the spiral gets bigger and bigger, the distances will get closer and closer to each other. [1]: https://i.sstatic.net/7r77U.png [2]: https://jsfiddle.net/anonymousey22/3rxhya8g/

[![enter image description here][1]][1]

I generated this with some JavaScript code, which you can find in this [JSFiddle][2].)

This looks good initially, but let's analyze what's going on here a little deeper.

This is because we are sampling the curve in increments that cause equal lengths along the curve, not equal lengths between consecutive points. As the spiral gets bigger and bigger, the distances will get closer and closer to each other. [1]: https://i.sstatic.net/7r77U.png [2]: https://jsfiddle.net/anonymousey22/3rxhya8g/

enter image description here

I generated this with some JavaScript code, which you can find in this JSFiddle.)

You can also try it out interactively on Desmos.


This looks good initially, but let's analyze what's going on here a little deeper.

This is because we are sampling the curve in increments that cause equal lengths along the curve, not equal lengths between consecutive points. As the spiral gets bigger and bigger, the distances will get closer and closer to each other.

deleted 2 characters in body
Source Link

This is because we are sampling the curve in increments that cause equal lengths along the curve, not equal lengths between consecutive points. As the spiral gets bigger and bigger, the distances will get closer and closer to each other. [1]: https://i.sstatic.net/7r77U.png [2]: https://jsfiddle.net/anonymousey22/3rxhya8g/1/https://jsfiddle.net/anonymousey22/3rxhya8g/

This is because we are sampling the curve in increments that cause equal lengths along the curve, not equal lengths between consecutive points. As the spiral gets bigger and bigger, the distances will get closer and closer to each other. [1]: https://i.sstatic.net/7r77U.png [2]: https://jsfiddle.net/anonymousey22/3rxhya8g/1/

This is because we are sampling the curve in increments that cause equal lengths along the curve, not equal lengths between consecutive points. As the spiral gets bigger and bigger, the distances will get closer and closer to each other. [1]: https://i.sstatic.net/7r77U.png [2]: https://jsfiddle.net/anonymousey22/3rxhya8g/

deleted 1 character in body
Source Link
Loading
Source Link
Loading