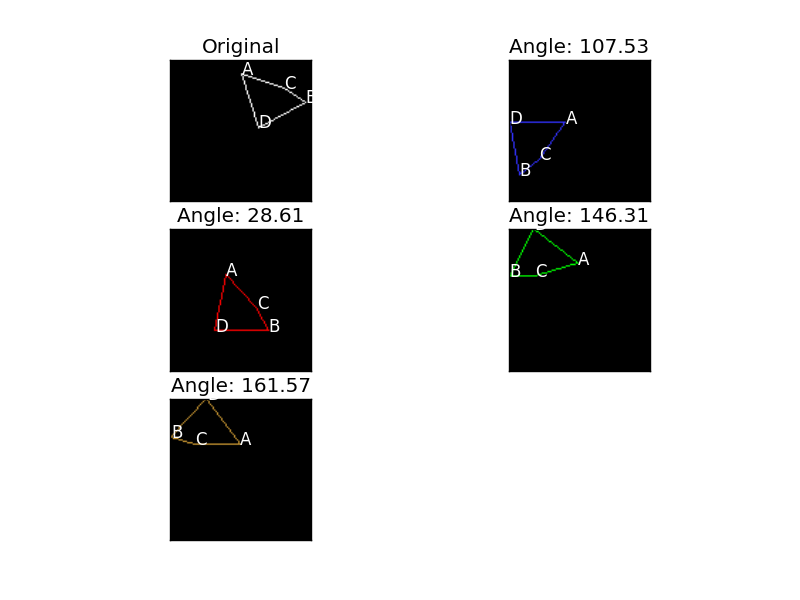
This algorithm is based on this answer for finding the angle between vectors, and this answer for rotating polygon points. It's written in Python, and assumes you want to align an edge with the X axis (horizontal axis). If you want to align it with the Y axis, replace the xVec in the code below with an yVec = [0,1].
EDITED: Added code for rotating the polygon and displaying the original and rotated polygons. Result of this script is displayed in the image below:
from PIL import Image, ImageDraw
from matplotlib import pyplot as plt
from math import radians, degrees, sqrt, acos, cos, sin

def dotproduct(v1, v2):
  return sum( (a*b) for a, b in zip(v1, v2) )

def length(v):
  return sqrt( dotproduct(v, v) )

def angle(v1, v2):
  return acos( dotproduct(v1, v2) / ( length(v1) * length(v2) ) )

def vec_subtraction( v1, v2 ):
    return [ e1 - e2 for e1, e2 in zip( v1, v2 ) ]

def calc_edge_vec(  poly, edge ):
    p1 = poly['points'][ edge[0] ]
    p2 = poly['points'][ edge[1] ]

    return vec_subtraction( p2, p1 )

def rotatePolygon( polygon, theta ):
    ''' Rotates the given polygon which consists of corners represented
        as (x,y), around the ORIGIN, clock-wise, theta degrees
    '''
    #theta = radians( theta )
    rotatedPolygon = []
    for corner in polygon:
        rotatedPolygon.append((
            corner[0] * cos( theta ) - corner[1] * sin( theta ), # x
            corner[0] * sin( theta ) + corner[1] * cos( theta )  # y
        ))

    minX = min( [ c[0] for c in rotatedPolygon ] ) * -1
    minX = minX if minX > 0 else 0
    minY = min( [ c[1] for c in rotatedPolygon ] ) * -1
    minY = minY if minY > 0 else 0

    rotatedPolygon = [ ( x + minX, y + minY ) for x, y in rotatedPolygon ]

    return rotatedPolygon

def draw_polygon( im, poly, color ):
    draw = ImageDraw.Draw( im )

    for e in poly['edges']:
        p1 = tuple( poly['points'][ e[0] ] )
        p2 = tuple( poly['points'][ e[1] ] )
        draw.line( [p1, p2], fill = color )

    del draw

p = {
    'points' : [ (50,10), (95,30), (80,20), (62,48) ],
    'edges'  : [ (3,0), (3,1), (1,2), (2,0) ]
}

yVec = [0,1] # Straight up along Y Vector - to align with
xVec = [1,0] # Horizontal axis

imgMode = 'gray'
im = Image.new( 'RGB', (100,100) )

# Draw original poly in white
draw_polygon( im, p, (255,255,255) )

plt.subplot( 3, 2, 1), plt.imshow( im ), plt.title( 'Original' ), plt.xticks([]), plt.yticks([])
for i, c in enumerate( p['points'] ):
    plt.text( c[0], c[1], "ABCD"[i], color = 'white' )

colors = [ (50,50,255), (255,0,0), (0,255,0), (200, 150, 50) ]

i = 2
for e, color in zip( p['edges'], colors ):
    edgeVec = calc_edge_vec( p, e )
    a       = angle( edgeVec, xVec )

    rotPol = p.copy()
    rotPol['points'] = rotatePolygon( p['points'], a )

    im = Image.new( 'RGB', (100,100) )
    draw_polygon( im, rotPol, color )
    plt.subplot( 3, 2, i ), plt.imshow( im )
    angleTitle = "Angle: " + str( round( degrees(a), 2 ) )
    plt.title( angleTitle ), plt.xticks([]), plt.yticks([])

    for idx, c in enumerate( rotPol['points'] ):
        plt.text( c[0], c[1], "ABCD"[idx], color = 'white' )

    i += 1

plt.show()
