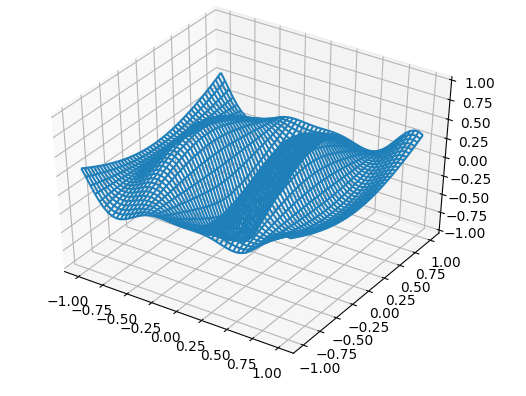
This is a screen shot from an animation generated by a matplotlib example
the key part in the code is
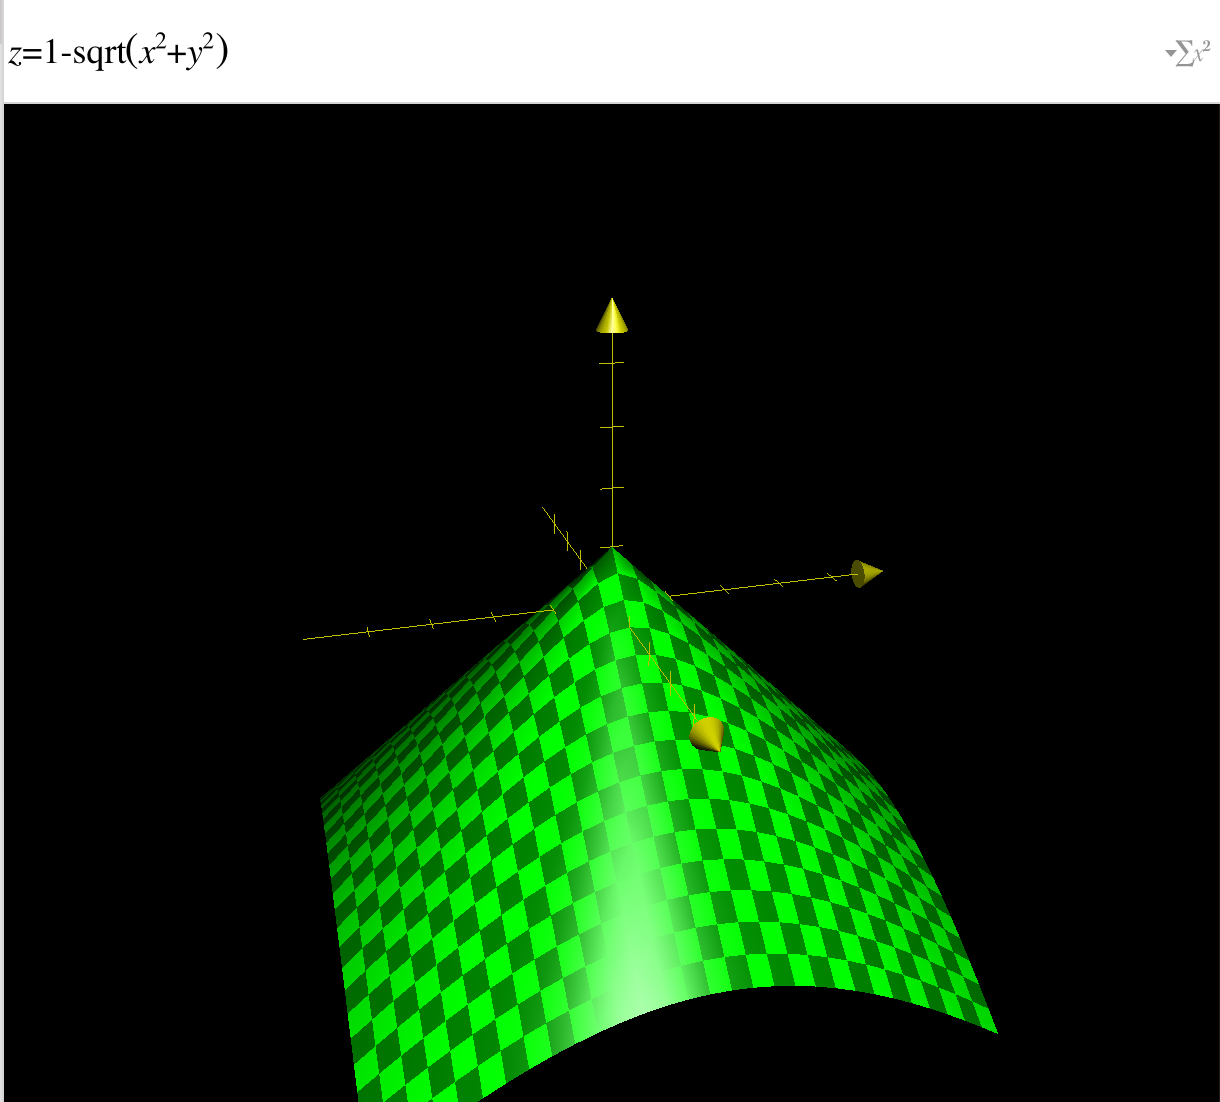
    R = 1 - np.sqrt(X**2 + Y**2)
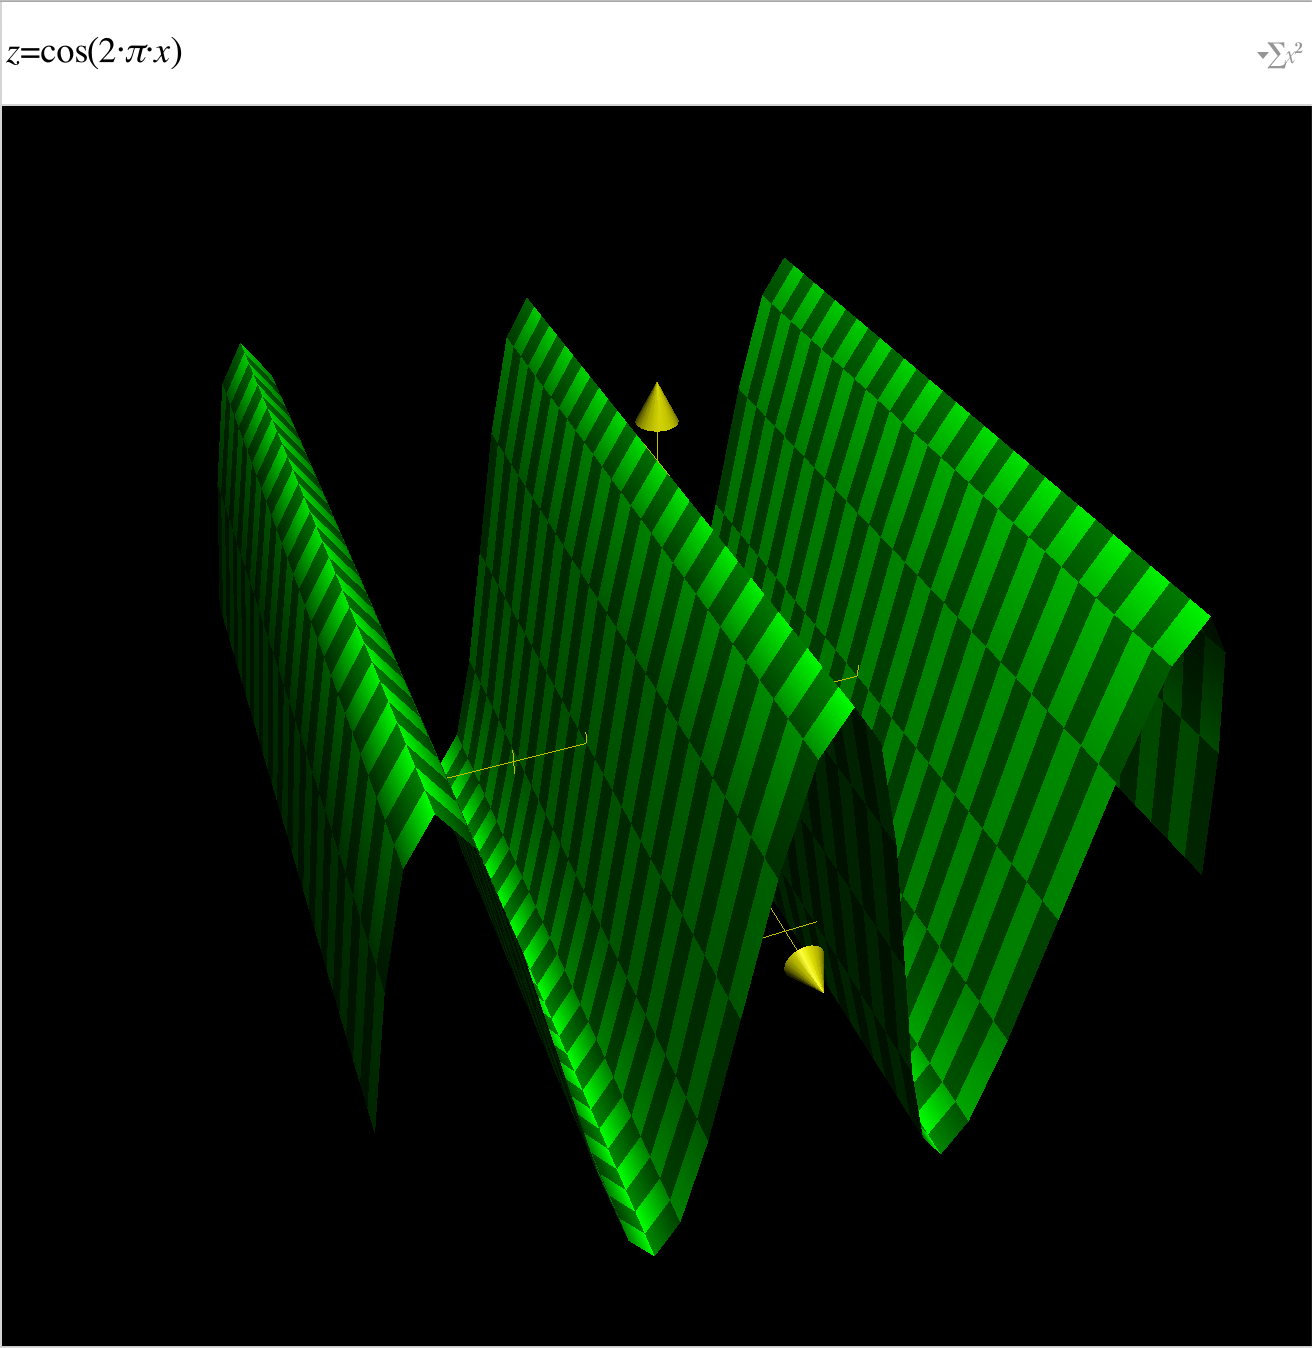
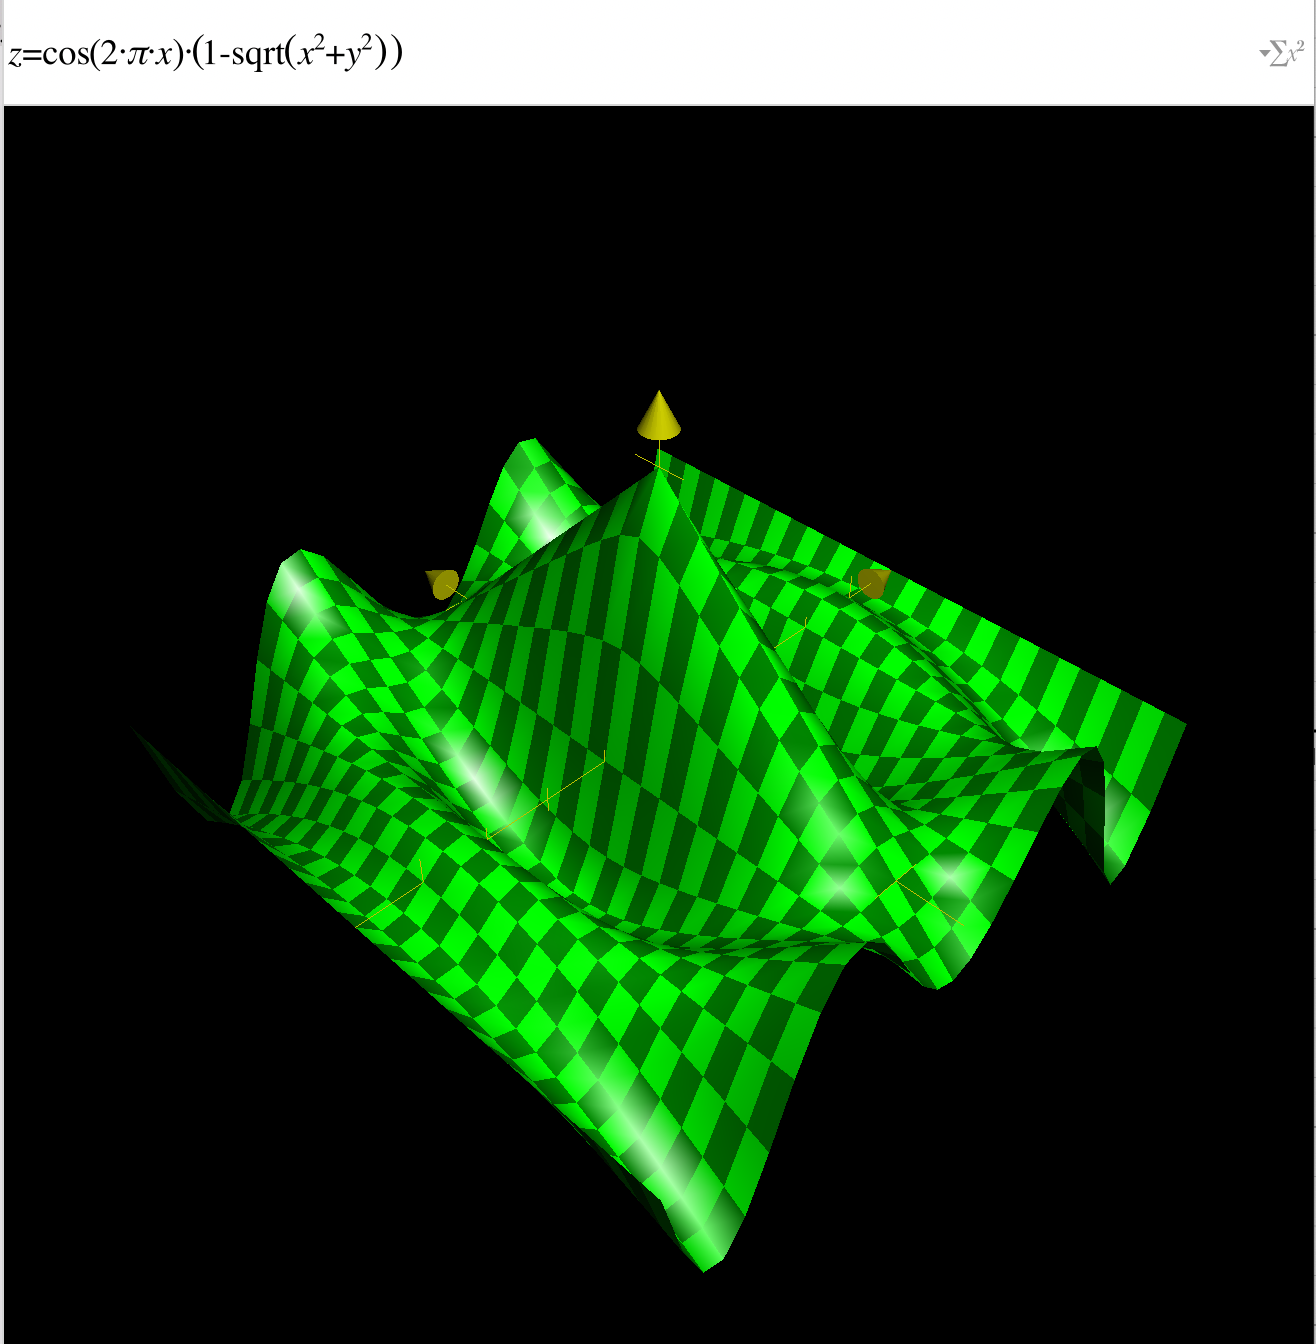
    Z = np.cos(2 * np.pi * X + phi) * R
corresponding equation is
$\left(- \sqrt{X^{2} + Y^{2}} + 1\right) \cos{\left (2 \pi X + \phi \right )}$
Could some give an explanation or hint about this kind of equation?
Is there a name of this type of graphics?
usually cosine/sine could generate something like a (half) circle, what does R part do?


