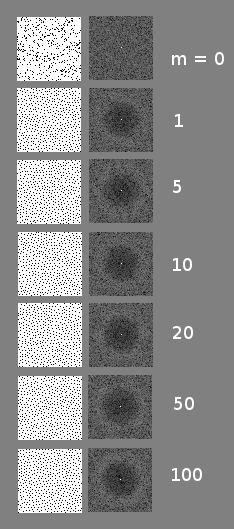
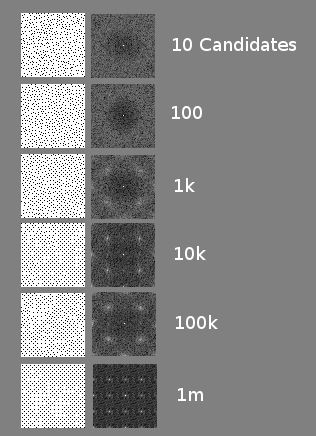
The problem turned out to be that you don't do the same number of candidates per point, but that if you have $n$ points already, you should generate $m*n$ candidates for the next point.
$m$ is a tuneable parameter where in general higher values of $m$ will take longer to calculate, but will result in higher quality sampling.
The reason that the candidate count should scale with the existing sample count is that it keeps statistics about the points constant, so lets you reason about how higher sample counts will look / behave by looking at lower sample counts.
Values of $m$ that are too high will end up looking like the lower images of the question though, where the randomness is almost completely gone.
The problem with the high sample counts is that they more fully cover all possible pixel locations, and since the best candidate is chosen, much randomness will go away leaving you with something a lot more deterministic.
I personally choose to do $m*n+1$ samples to slightly simplify the logic and let it handle the first sample when $n=0$.
This technique was described in this paper:
"Spectrally optimal sampling for distribution ray tracing" Mitchell 1991.
https://dl.acm.org/citation.cfm?id=122718.122736
Below is the same setup as in the question where 455 black pixels are placed in a 64x64 image, showing the result for some values of $m$. The quality is surprisingly good even for low values of $m$ and the execution time is much, much lower than the process described in the question. I'm also limiting the candidate count to be at maximum 1/2 the number of pixels (an arbitrary limit I came up with) in the image to keep the candidate count from going too high for denser samplings in an effort to keep the quality and computation time decent.
I've heard that storing points in grids can help in accelerating the calculation time of "how far is this candidate from the closest point" and I believe it should, but I haven't tried it yet.
When $m=0$, it's equivelant to white noise and just randomly placing the dots.
Note that when calculating the distance between two points I am treating the image as if it wraps around, so that dots on opposite edges are treated close together. If interested in details of how to calculate distance in wrap around (toroidal) space, check out this blog post:
https://blog.demofox.org/2017/10/01/calculating-the-distance-between-points-in-wrap-around-toroidal-space/
Here is a blog post on Mitchell's best candidate algorithm too I wrote up:
https://blog.demofox.org/2017/10/20/generating-blue-noise-sample-points-with-mitchells-best-candidate-algorithm/


